
Figure 2. SNP-IV but not SNP-SC resulted in intratumoral vaccine distribution and DC maturation.
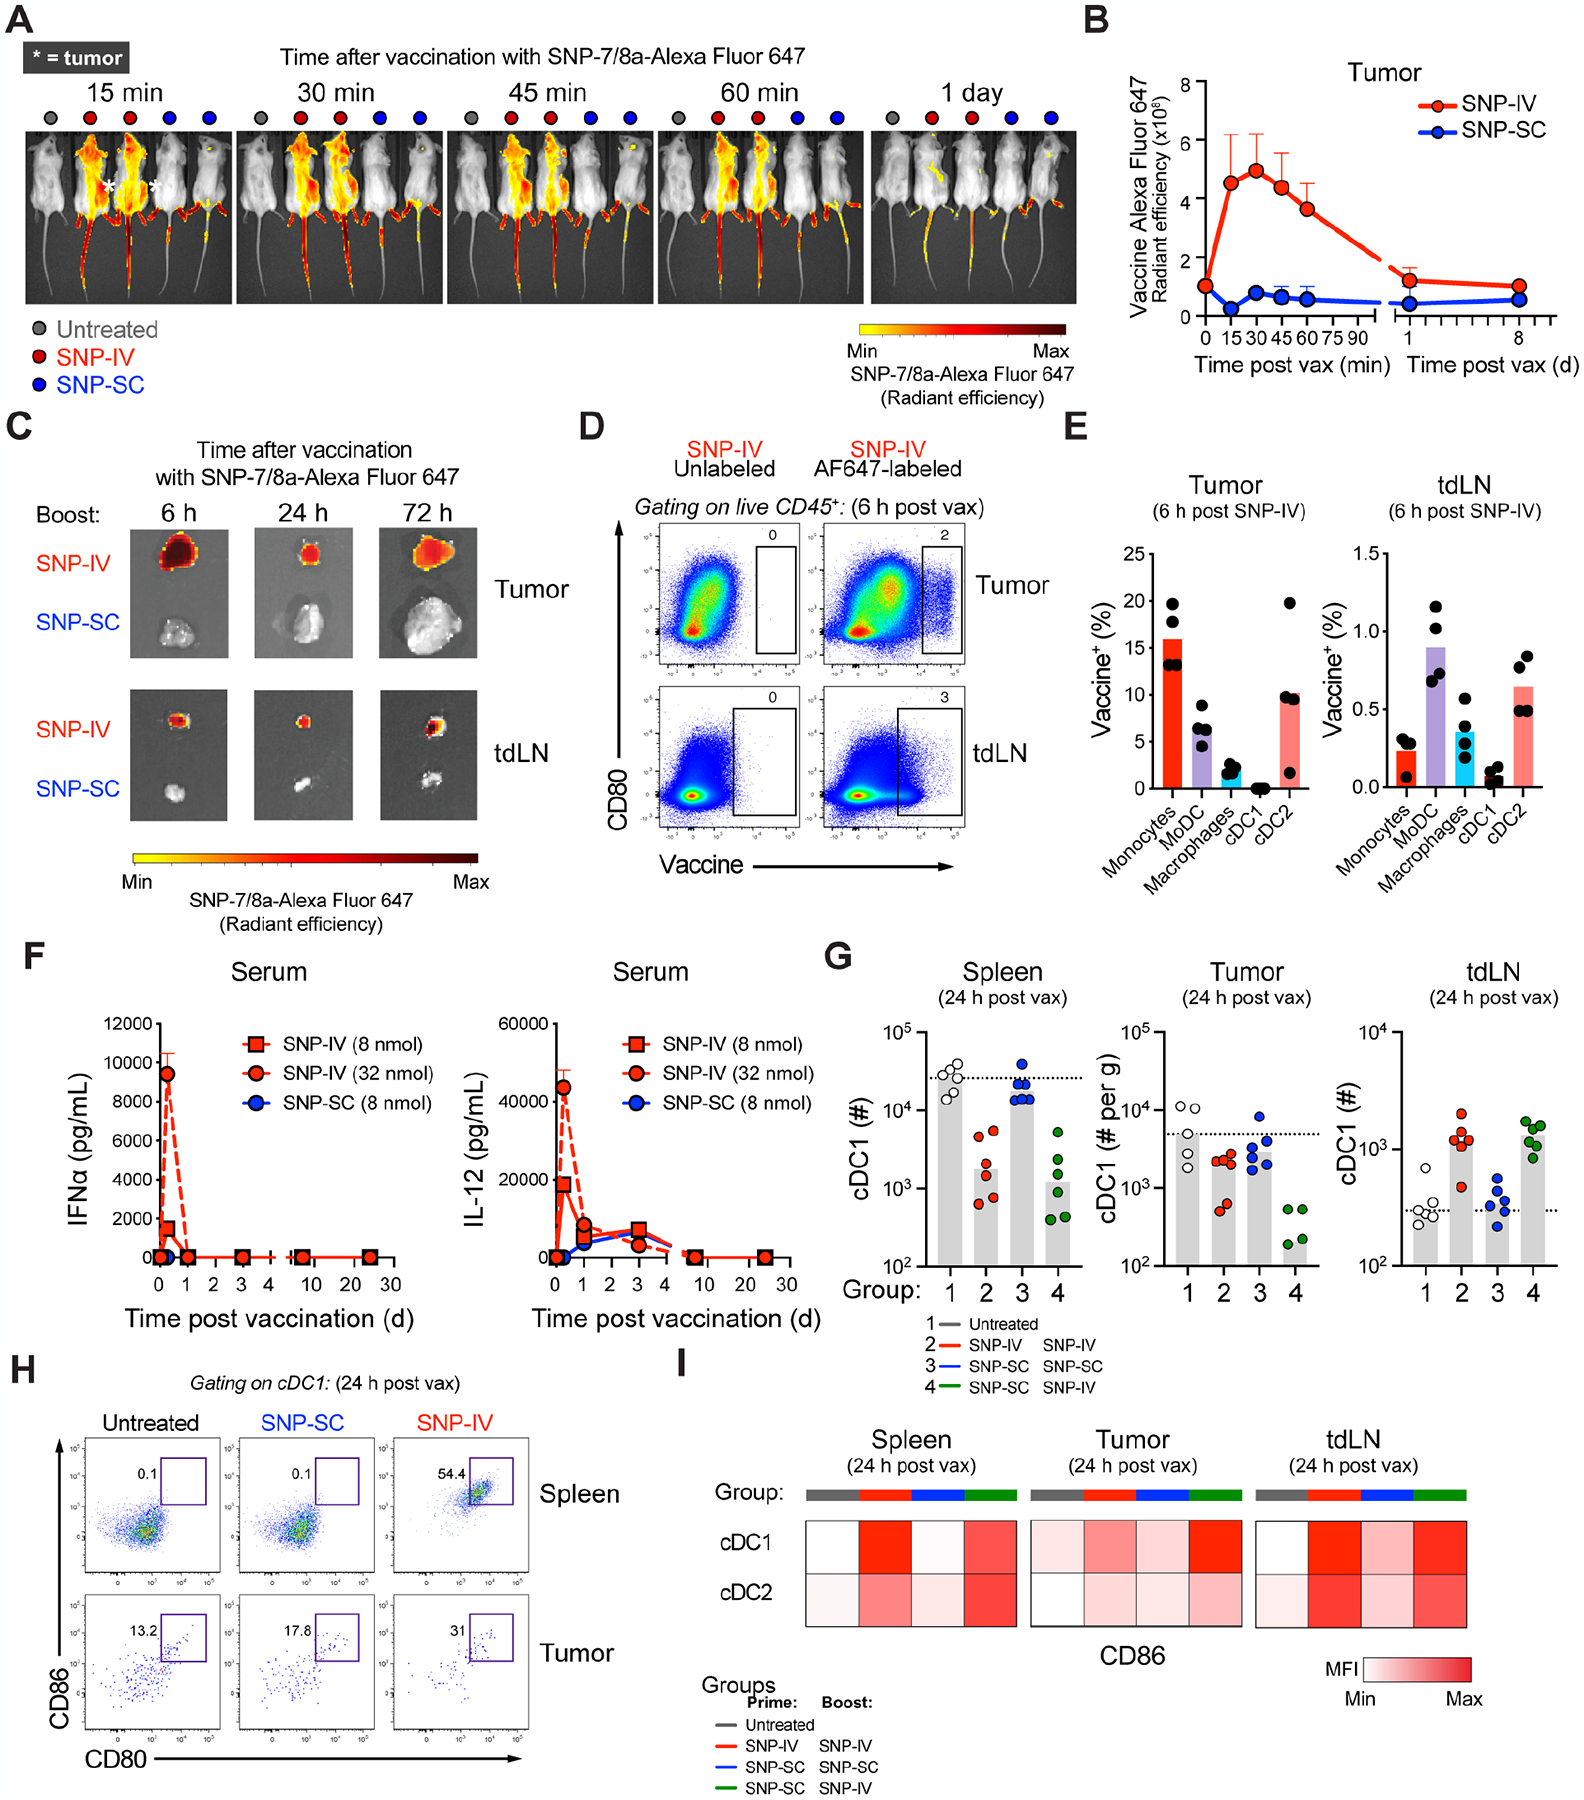
(A) In vivo imaging of mice following vaccination with fluorescently-labeled SNP-7/8a (n=4).
(B) Fluorescence radiant efficiency over time after fluorescently-labeled SNP-SC or SNP-IV gating on tumor as the region of interest (ROI) (n=4).
(C) Harvested tumor (top) and tumor-draining LNs (bottom) after SNP-IV or SNP-SC over time (n=2).
(D) Flow cytometry analysis of fluorescently-labeled SNP-7/8a and CD80 in tumor (top) and tumor-draining LN (n=4).
(E) Bar graphs summarize the frequency of myeloid cell populations of total vaccine+ cells in tumor (left) or tumor-draining LN (right) (n=4).
(F) Measurement of cytokines IFNα (left) and IL-12 (right) in sera of mice after SNP-SC or SNP-IV at 8 nmol and 32 nmol (n=3).
(G) Bar graphs summarize the numbers of cDC1 in spleen (left), tumor (middle) and tumor-draining LN (right) of mice that were untreated (white) or treated with SNP-IV prime and boost (red), SNP-SC prime and boost (blue) or SNP-SC prime followed by SNP-IV boost (green) (n=4–6).
(H) Flow cytometry analysis of cDC1s 24 h after SNP-SC or SNP-IV vaccination in the spleen (top) and tumor (bottom) (n=6).
(I) Heatmaps represent the median MFI of CD86 after SNP-IV prime and boost (red), SNP-SC prime and boost (blue) or SNP-SC prime followed by SNP-IV boost (n=6).