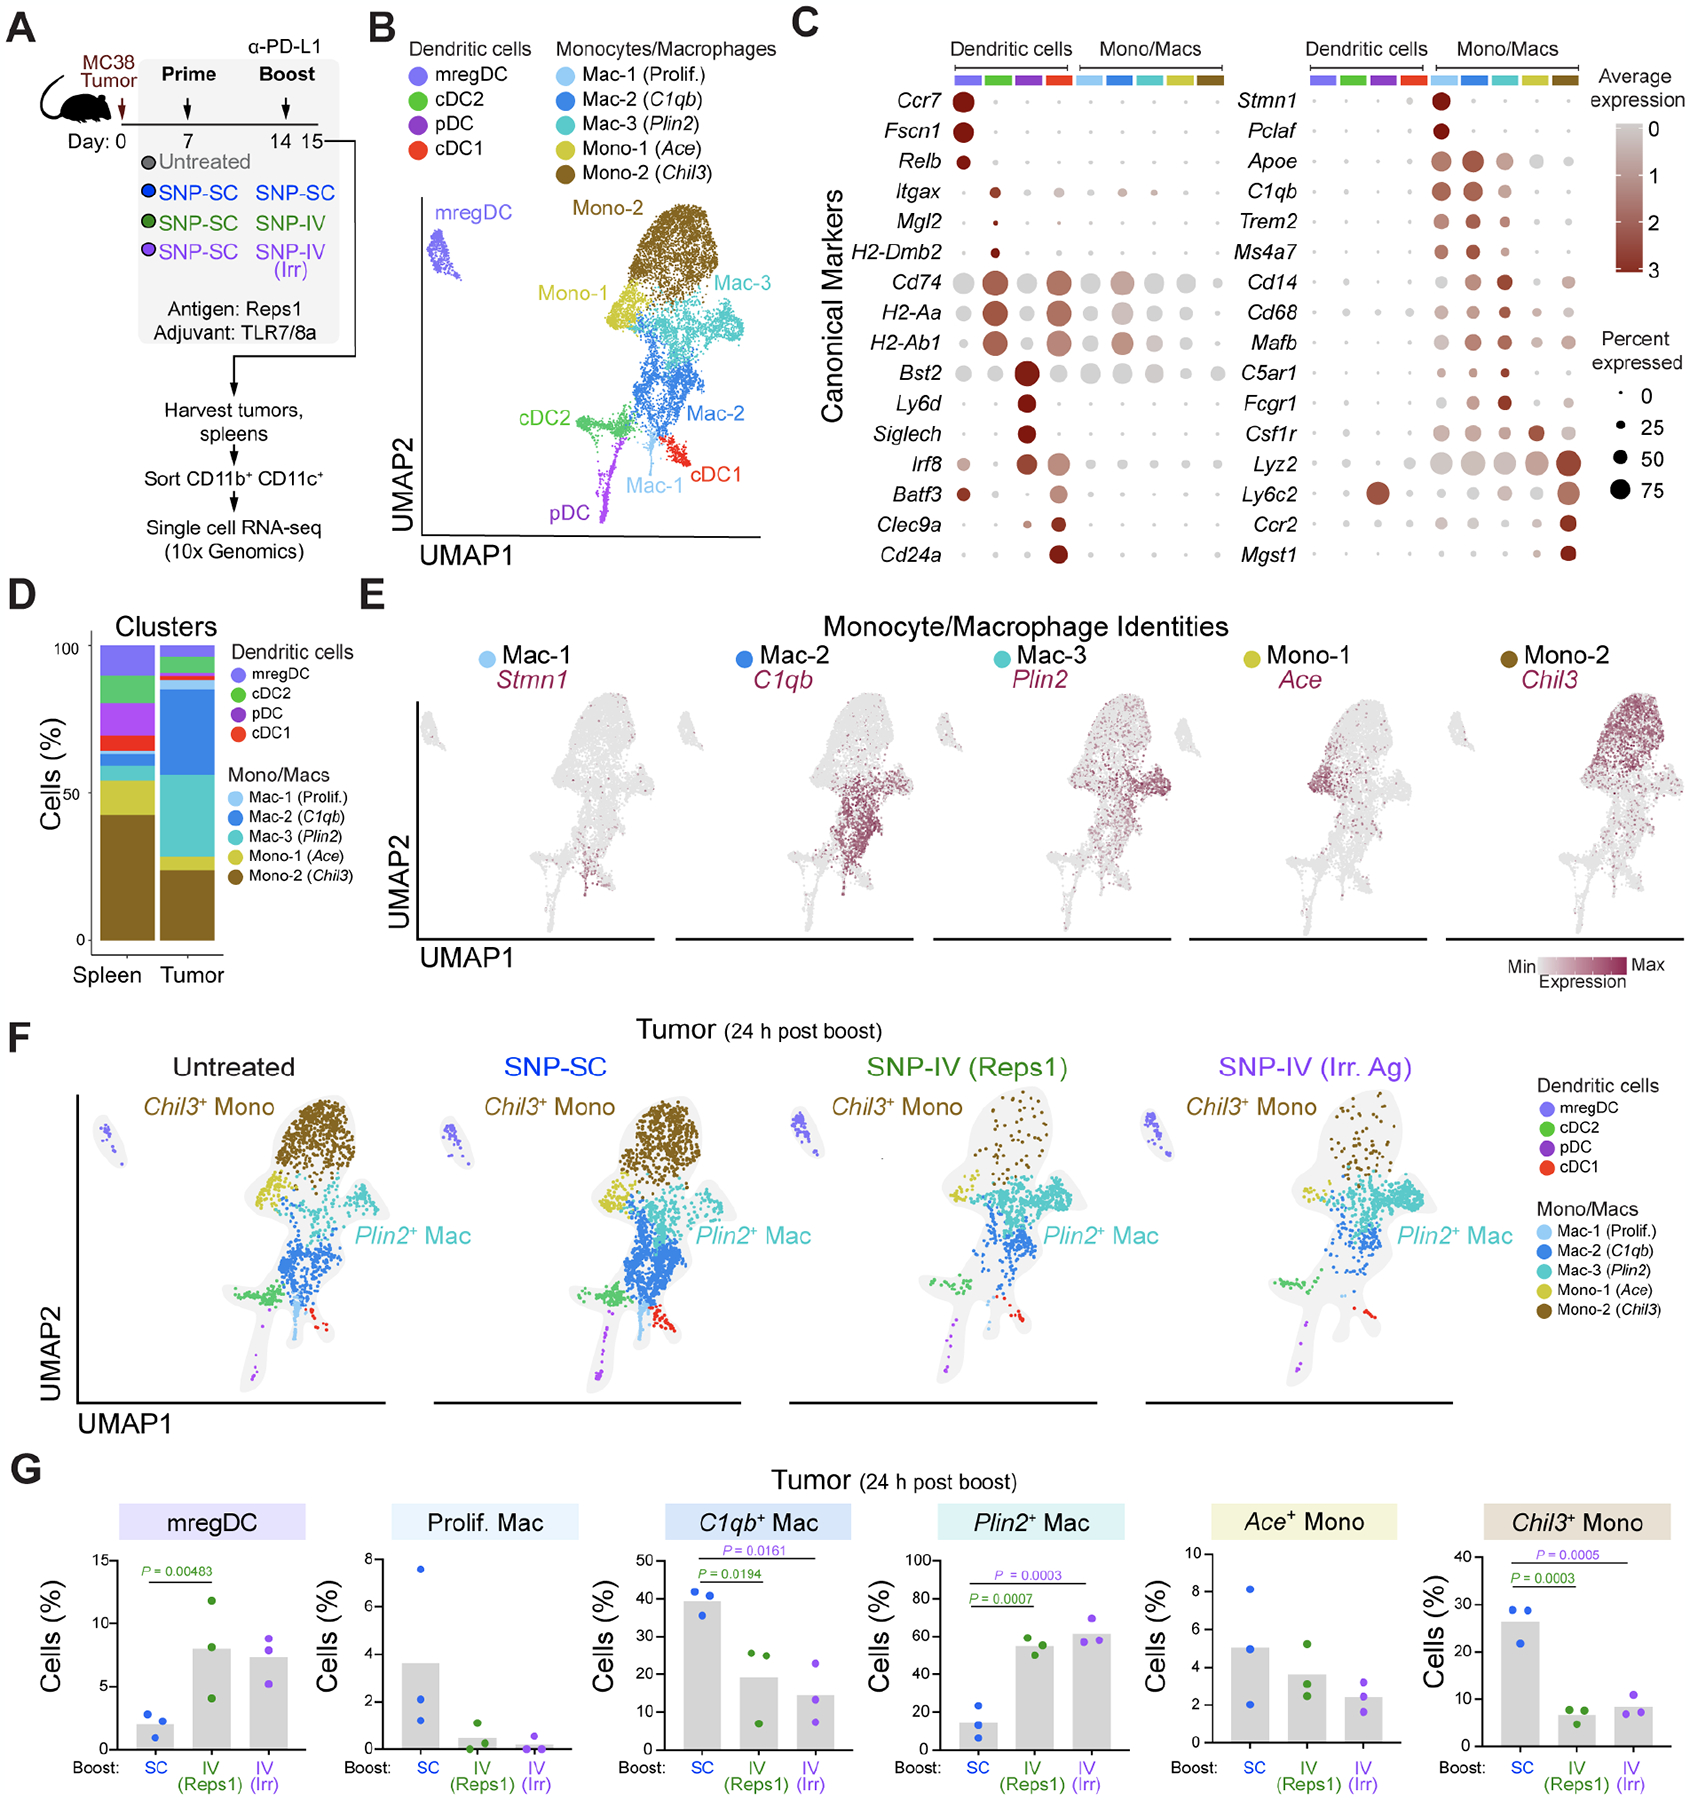
Figure 3. scRNA-seq of tumors revealed that intratumoral Chil3+ monocytes were significantly reduced after SNP-IV.

(A) Schematic of therapeutic study design. Mice (n=3) were implanted with MC38 and treated with SNP-7/8a (Reps1) on day 7 and day 14 together with CPI. Spleens and tumors were harvested on day 15. scRNA-seq was performed on flow sorted myeloid cells.
(B) UMAP of total monocytes, macrophages and DCs identified as 9 metaclusters in spleen and tumor on day 15.
(C) Dot plot of canonical markers identifying specific DC, monocyte and macrophage subsets.
(D) Bar graph shows proportion of individual metaclusters identified in spleen or tumor.
(E) Feature plots highlight individual genes C1qb, Plin2, Ace and Chil3 used to annotate monocyte/macrophage clusters.
(F) UMAPs of tumor MNP in untreated mice or mice treated with SNP-SC prime followed by SNP-SC boost (blue), SNP-IV (Reps1) boost (green) or SNP-IV (irrelevant antigen) boost (purple).
(G) Bar graphs summarize frequencies of individual metaclusters in SNP-SC (blue), SNP-IV (Reps1) (green), or SNP-IV (irrelevant antigen) boosted animals. Statistics were assessed by one-way ANOVA.
