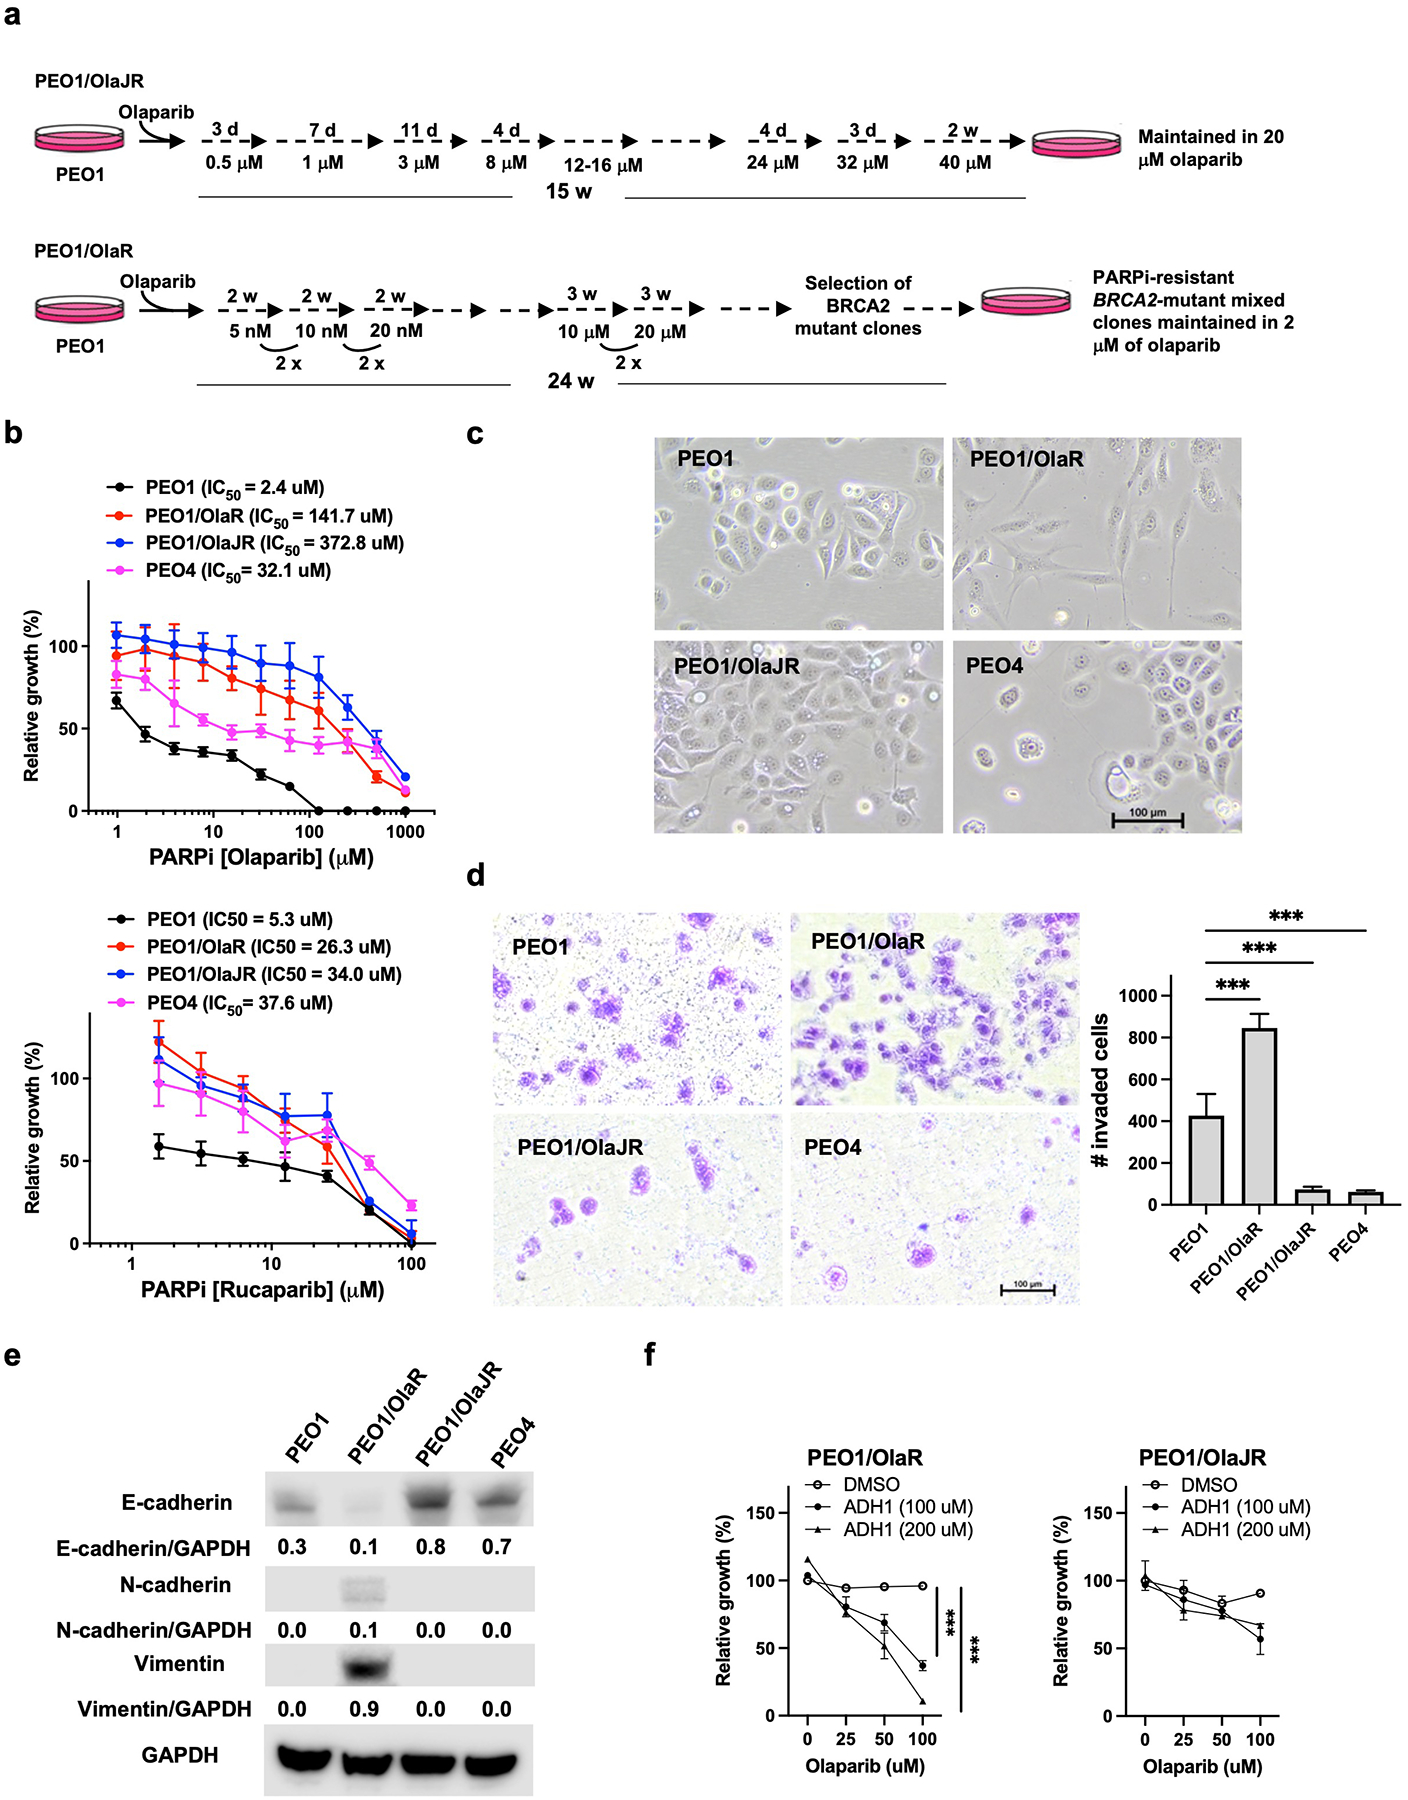
Fig. 1. Different treatment schemes cause distinct phenotypes of PARPi-resistant BRCA2-mutant PEO1 cell lines.

(a) Olaparib treatment schemes of PEO1/OlaJR and PEO1/OlaR. d, days; wk, weeks. (b) Cell growth was examined by XTT assay. Cells were treated with olaparib or rucaparib at indicated doses for 72 hours. IC50 values were calculated using GraphPad Prism v.7.1. (c) Cell morphology of parental PEO1, OlapR variants (PEO1/OlaR and PEO1/OlaJR), and de novo PARPi-resistant PEO4. (d) The invasion abilities were assessed by transwell invasion assay. (e) Western blotting of E-cadherin, N-cadherin, vimentin, and GAPDH. Densitometric values of these proteins relative to GAPDH are shown. (f) Cell growth was examined by XTT assay. Cells were treated with olaparib and/or N-cadherin inhibitor (ADH-1) at indicated doses for 72 hours. ***, p < 0.001.
