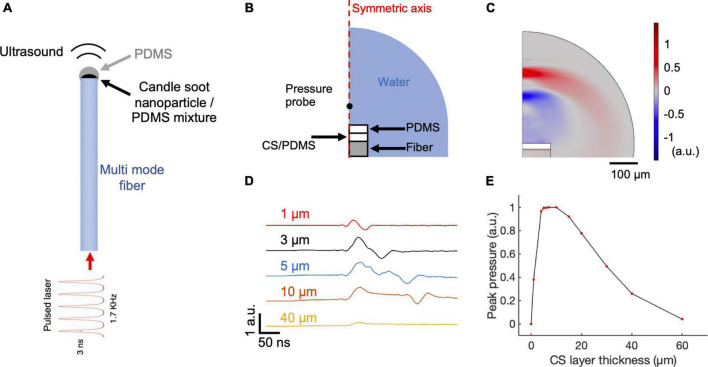
FIGURE 1.
COMSOL simulation of CSFOE performance. (A) Schematic of CSFOE. (B) Illustration of the CSFOE model used in simulation. Not to scale. (C) Representative ultrasound waveform, simulated at t = 400 ns under an input of a 3 ns pulsed laser. (D) Acoustic waveforms simulated at different thicknesses of the CS layer. (E) Peak-to-peak acoustic pressure plotted as a function of candle soot layer thickness.

