FIGURE 4.
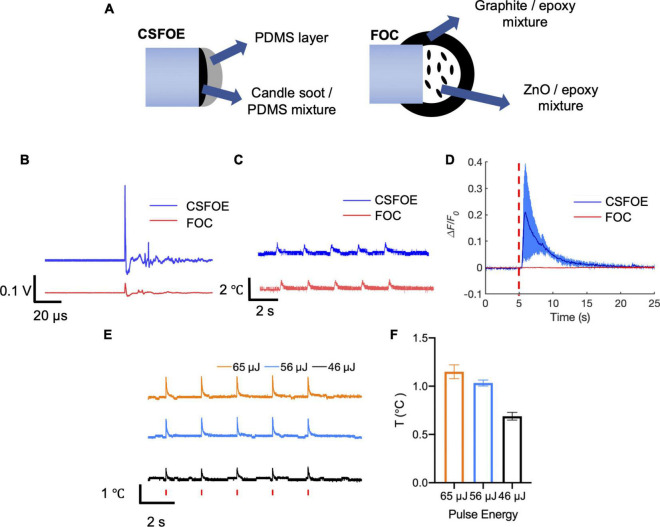
Comparison of CSFOE and FOC. (A) Schematics of the CSFOE and FOC. (B) Photoacoustic signal of CSFOE and FOC, measured by a 5 MHz transducer under the same laser condition: 1,030 nm, 3 ns, 1.7 kHz, 48 mW. (C) Temperature rise measured by a thermal probe placed at the surface of CSFOE and FOC, respectively. (D) Representative calcium traces of GCaMP6f transfected neurons stimulated by CSFOE (Blue) and FOC (Red) under the same laser energy input of 56 μJ. (E) Temperature rise measured by the thermal probe placed at ∼10 μm away from CSFOE under the laser energy used in neuromodulation experiments. Red vertical bars indicate the laser on. Laser condition: 1,030 nm, 1.7 kHz repetition rate, 3 ms duration for each burst. Laser pulse energy is shown in the figure. (F) Measured maximum temperature increases at corresponding pulse energy inputs (N = 5 for each energy).

