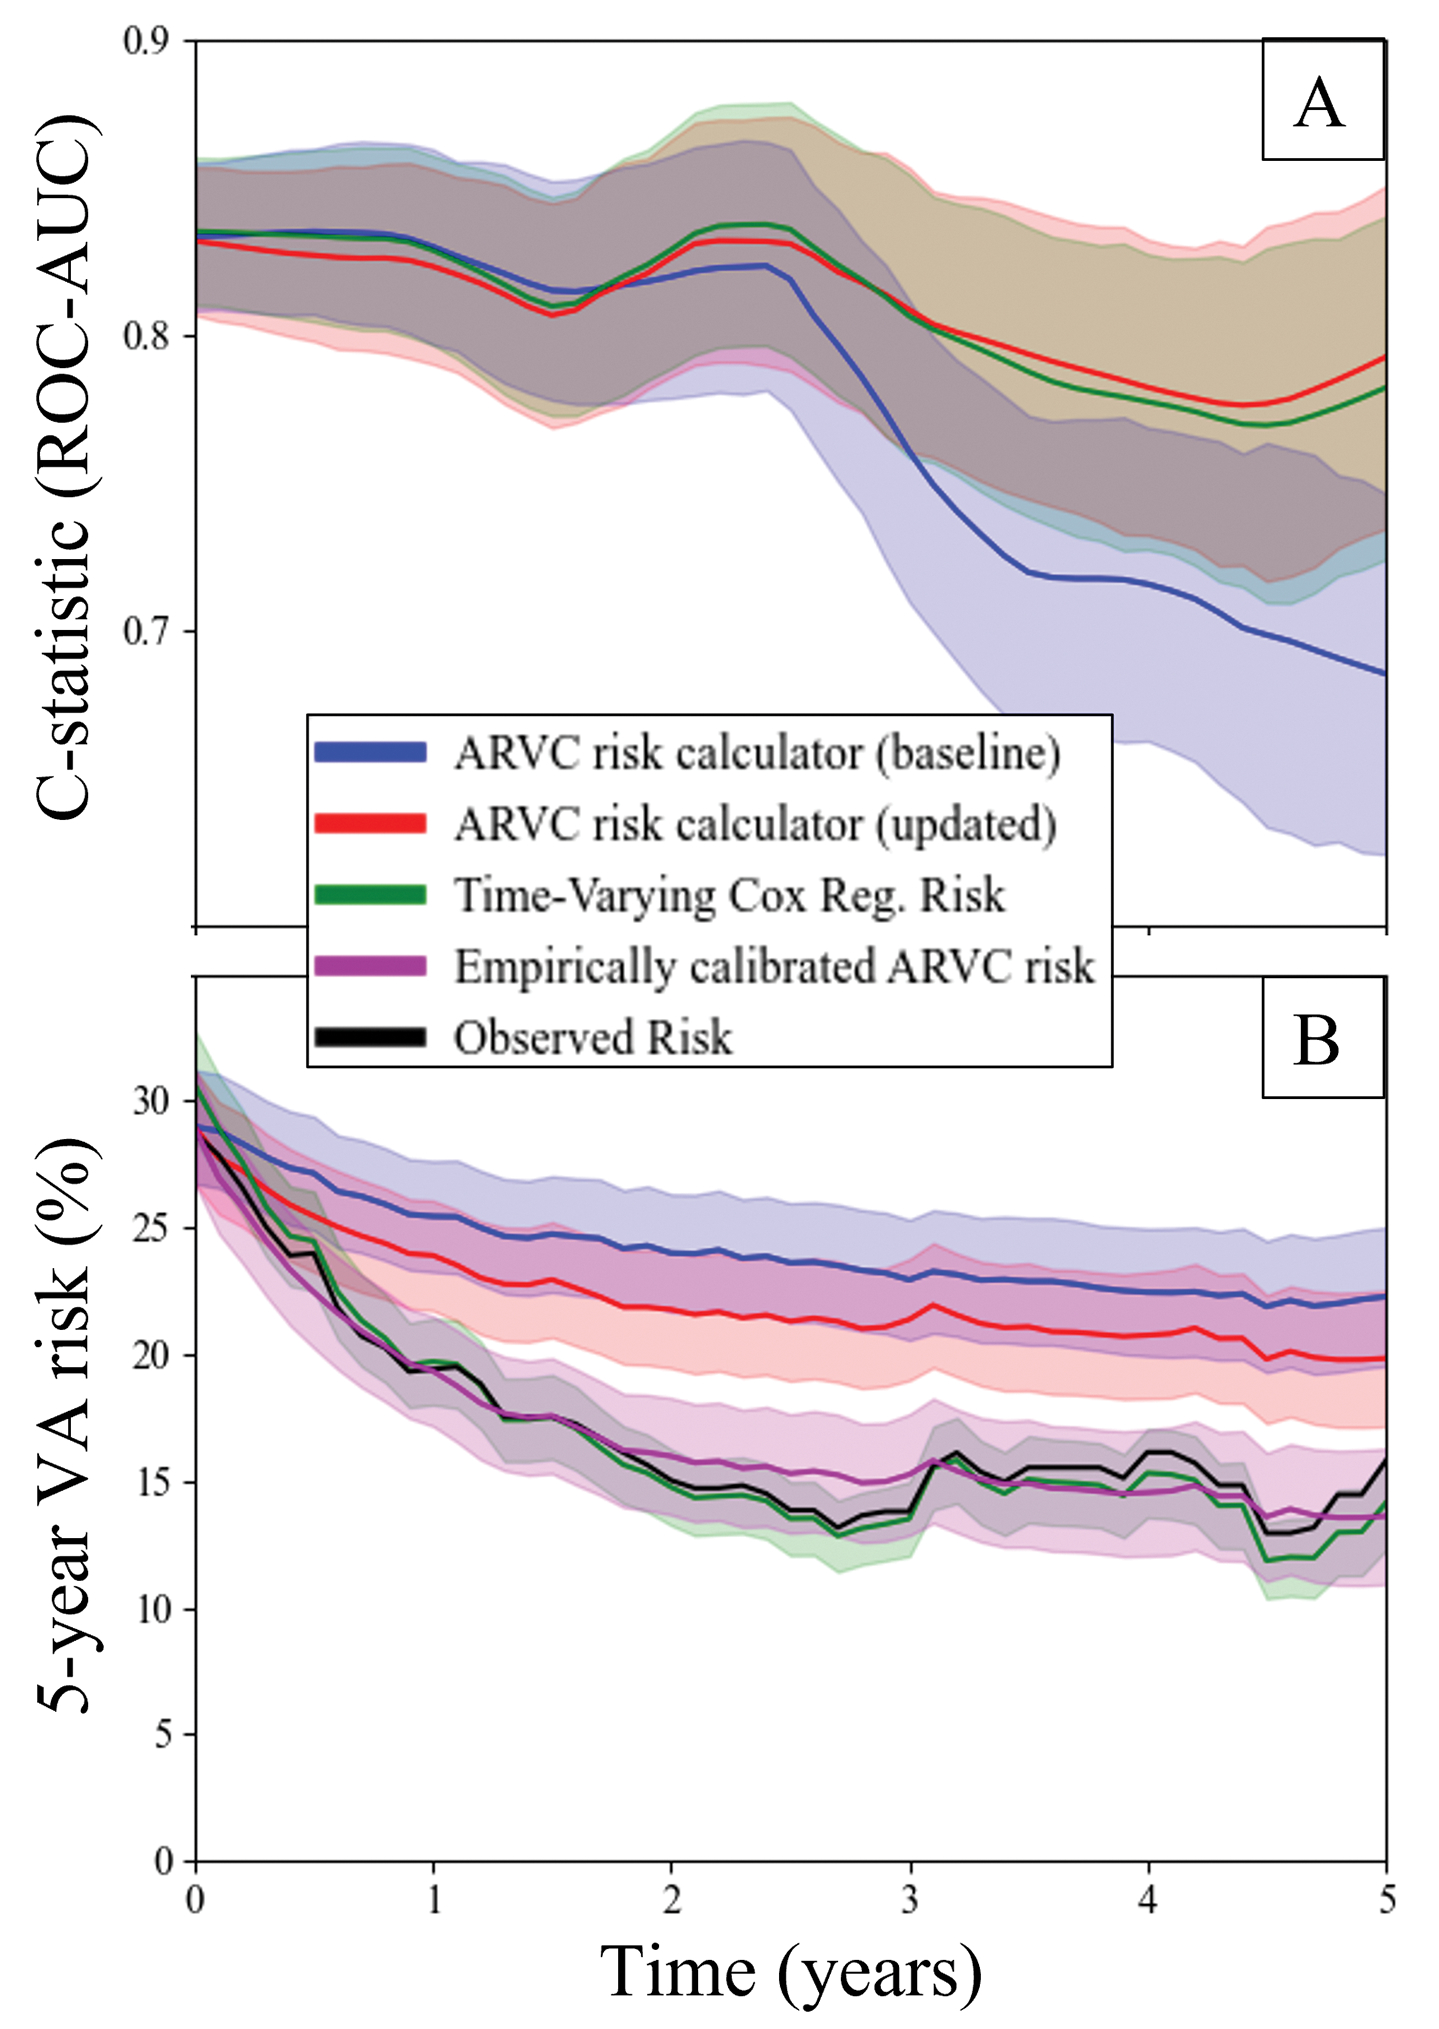
Figure 3:

A) Longitudinal changes in model discrimination for (blue) the baseline ARVC risk calculator, (red) the updated ARVC risk calculator, and (green) time-varying Cox regression risk. Plots are shown with LOWESS smoothing and standard errors of the mean. B) Longitudinal calibration between predictions made by (blue) baseline ARVC risk calculator, (red) updated ARVC risk calculator, (green) time-varying cox regression risk, compared to observed risk (black). The updated ARVC risk calculator risk was recalibrated using an empiric exponential decay function (magenta). Here observed risk is shown with 95% confidence intervals, and model predictions are shown with standard errors of the mean.
