
Figure 3. Glutamate release probability varies among LC‐NA inputs.
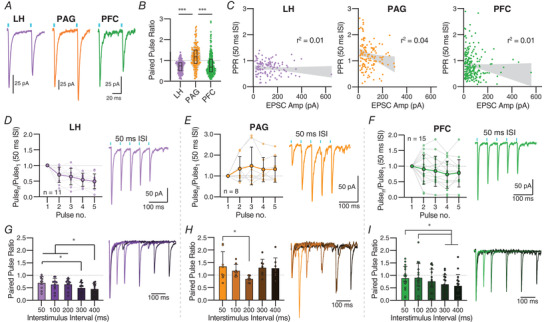
A, representative traces showing paired pulse ratios (PPR) at a 50 ms interstimulus interval (ISI) for LH (left; purple), PAG (centre; orange) and PFC (right; green). B, quantification of paired pulse ratios at a 50 ms ISI (mean ± SEM). Kruskal–Wallis ANOVA with post hoc Dunn's test, H(2) = 80.11, P < 0.0001; ***LH vs. PAG P < 0.0001, LH vs. PFC P = 0.87, ***PAG vs. PFC P < 0.0001. C, scatter plots showing the relationship between PPRs and EPSC amplitudes; the size of the response did not significantly account for variability in PPR. D–F, quantification (left) and representative traces (right) for trains of 5 pulses with 50 ms ISIs. For each input a RMANOVA with post hoc Tukey's test was used to compare the ratio of pulse n to pulse1. D, LH had a significantly lower ratio for pulses 4 and 5 as compared to pulse 2 (F(4, 40) = 19.70, P < 0.0001). E, PAG facilitated at all stimulations with significant differences between them (F(4, 28) = 1.83, P = 0.15). F, PFC responses on average depressed for all pulses (F(4, 56) = 2.72, P = 0.0383). G–I, quantification (left) and representative traces (right) for PPRs of varying ISI (50–400 ms). For each input a RMANOVA with post hoc Tukey's test was used to compare PPRs. G, LH inputs depressed at all ISIs, with PPR300 < PPR50, PPR400 < PPR50, PPR100 and PPR200 (F(4, 40) = 5.93, P = 0.0008). H, PAG inputs facilitated at all ISIs except 200 ms, which was significantly less than 50 ms (F(4, 28) = 2.95, P = 0.0376). I, PFC inputs depressed for all frequencies with PPR100 > PPR300 and PPR400 (F(4, 60) = 5.60, P = 0.0007). Traces for each of the 5 ISIs are shown overlapped with their first peak normalized to 1; the shade of each trace corresponds to that in the bar graph, going from lightest to darkest with increasing ISI. Summary data are means ± SD. *P < 0.05, ***P < 0.001. [Colour figure can be viewed at wileyonlinelibrary.com]