
Figure 4. Peptidergic modulation of isolated afferents.
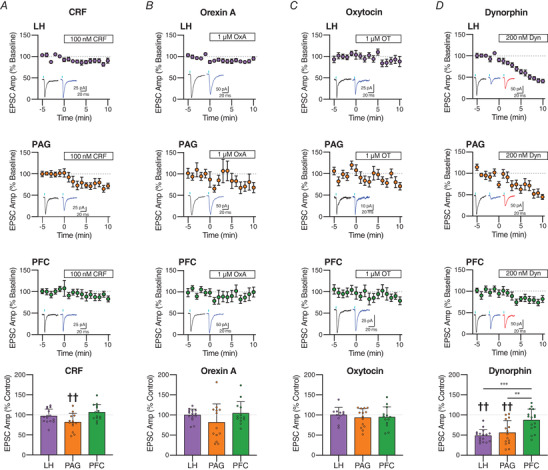
A, effect of CRF (100 nm) on LH, PAG and PFC inputs. Quantification of average amplitudes normalized to baseline is shown for LH (n = 15/9), PAG (n = 9/8) and PFC (n = 18/9), with representative traces of the last 5 min of baseline (black) and CRF (blue) to the right of the time course. Bottom: quantification of the average EPSC amplitude after 6 to 10 min CRF application. CRF significantly reduced EPSC amplitudes only in PAG afferents (18.58 ± 21.94% decrease, t = 3.054, P = 0.01). B, effect of orexin A (OxA; 1 μm) on LH, PAG and PFC inputs. Quantification of average amplitudes normalized to baseline is shown for LH (n = 16/9), PAG (n = 12/10) and PFC (n = 13/8), with representative traces of the last 5 min of baseline (black) and OxA (blue) to the right of the time course. Bottom: quantification of the average EPSC amplitude after 6–10 min OxA application. C, effect of oxytocin (OT, 1 μm) on LH, PAG and PFC inputs. Quantification of average amplitudes normalized to baseline is shown for LH (n = 11/8), PAG (n = 14/11) and PFC (n = 13/10), with representative traces of the last 5 min of baseline (black) and OT (blue) to the right of the time course. Bottom: quantification of the average EPSC amplitude after 6–10 min OT application. D, effect of dynorphin (Dyn, 200 nm) on LH, PAG and PFC inputs. Quantification of average amplitudes normalized to baseline is shown for LH (n = 17/10), PAG (n = 15/10), and PFC (n = 16/11), with representative traces of the last 5 min of baseline (black) and Dyn (blue) to the right of the time course. Bottom: quantification of the average EPSC amplitude after 6–10 min dynorphin application. LH and PAG amplitudes reduced significantly more than PFC (one‐way ANOVA, F(2, 44) = 15.47, P < 0.0001; post hoc Tukey's test, ***LH < PFC, ***PAG < PFC). Time course data are means ± SEM. Summary data in bar graphs are means ± SD. ††P < 0.01, **P < 0.01, ***P < 0.001. [Colour figure can be viewed at wileyonlinelibrary.com]