
Extended Data Fig. 2 |. Off-target expression after intrapancreatic delivery of AAV.
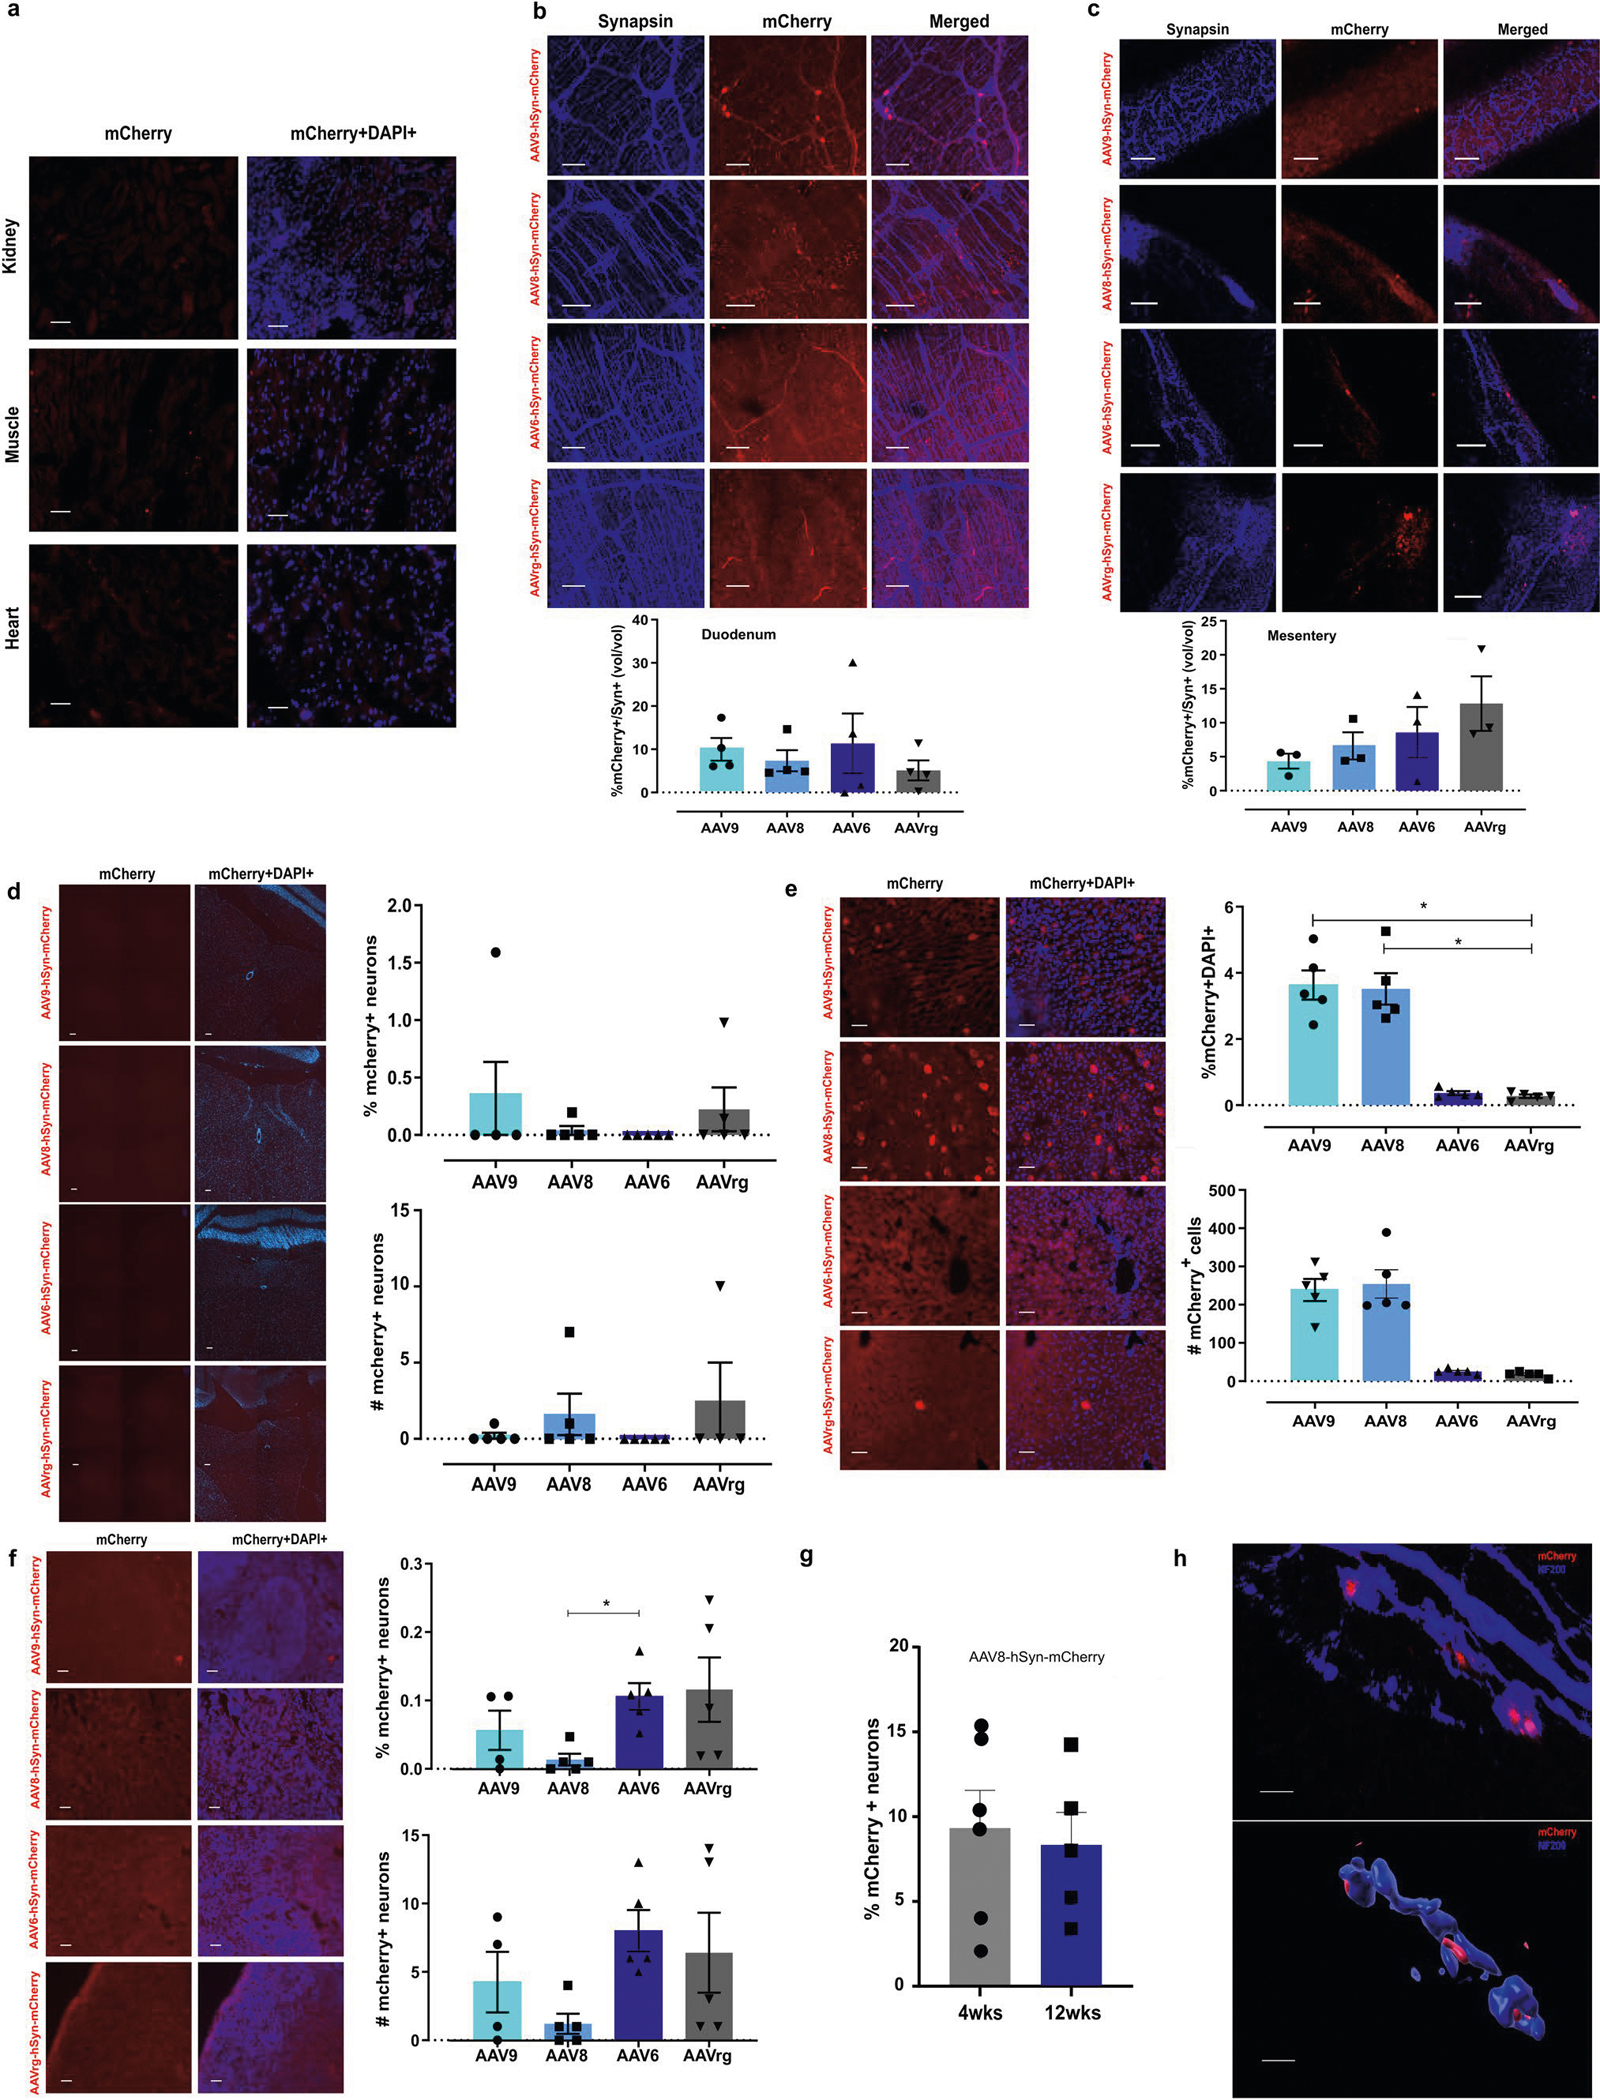
a) Off-target mCherry expression in kidney, muscle and heart, 4 weeks after intrapancreatic AAV8-hSyn-mCherry injection. Scale bars: 50 μm. b) Expression of mCherry 4 weeks after intrapancreatic injection of AAV8-hSyn-mCherry injection (serotypes 6, 8, 9 and rg). c) Images of mCherry and Synapsin in enteric nerves (duodenum). Scale bars: 100 μm. Quantification of viral expression as mCherry+ volume within Synapsin+ volume (bottom panel). n = 4 mice/group. d) Images of mCherry and Synapsin in mesenteric fibers. Scale bars: 50 μm. Quantification of mCherry+ volume within Synapsin+ volume in mesentery (bottom panel). n = 3 mice/group. e) Images of hindbrain stained for mCherry. Scale bars: 100 μm. Right panel: mCherry+ expression as percentage (upper) and total number (lower), n = 5 mice/group. f) Images of mCherry in liver. Scale bars: 50 μm. Right panel: expression of mCherry+ cells as percentage (upper) and total number (lower), n = 5 mice/group. g) Images of mCherry in spleen. Scale bars: 50 μm. Right: expression of mCherry+ cells as percentage (upper) and total number (lower), n = 5 mice/group. h) Quantification of mCherry+ neurons in CG, 4 (N = 6 mice) and 12 (N = 5 mice) weeks after intrapancreatic injection of AAV8-hSyn-mCherry, 1*1011 vg. i) Confocal images (left) and 3D volume segmentation analysis (right) of mCherry + /NF200 + intrapancreatic ganglia after intrapancreatic delivery of AAV8-hsyn-mCherry. N = 88 ganglia from 20 mice in 5 independent studies. Scale bar: 30 μm. Statistical analyses are described in Supplementary Table 3.