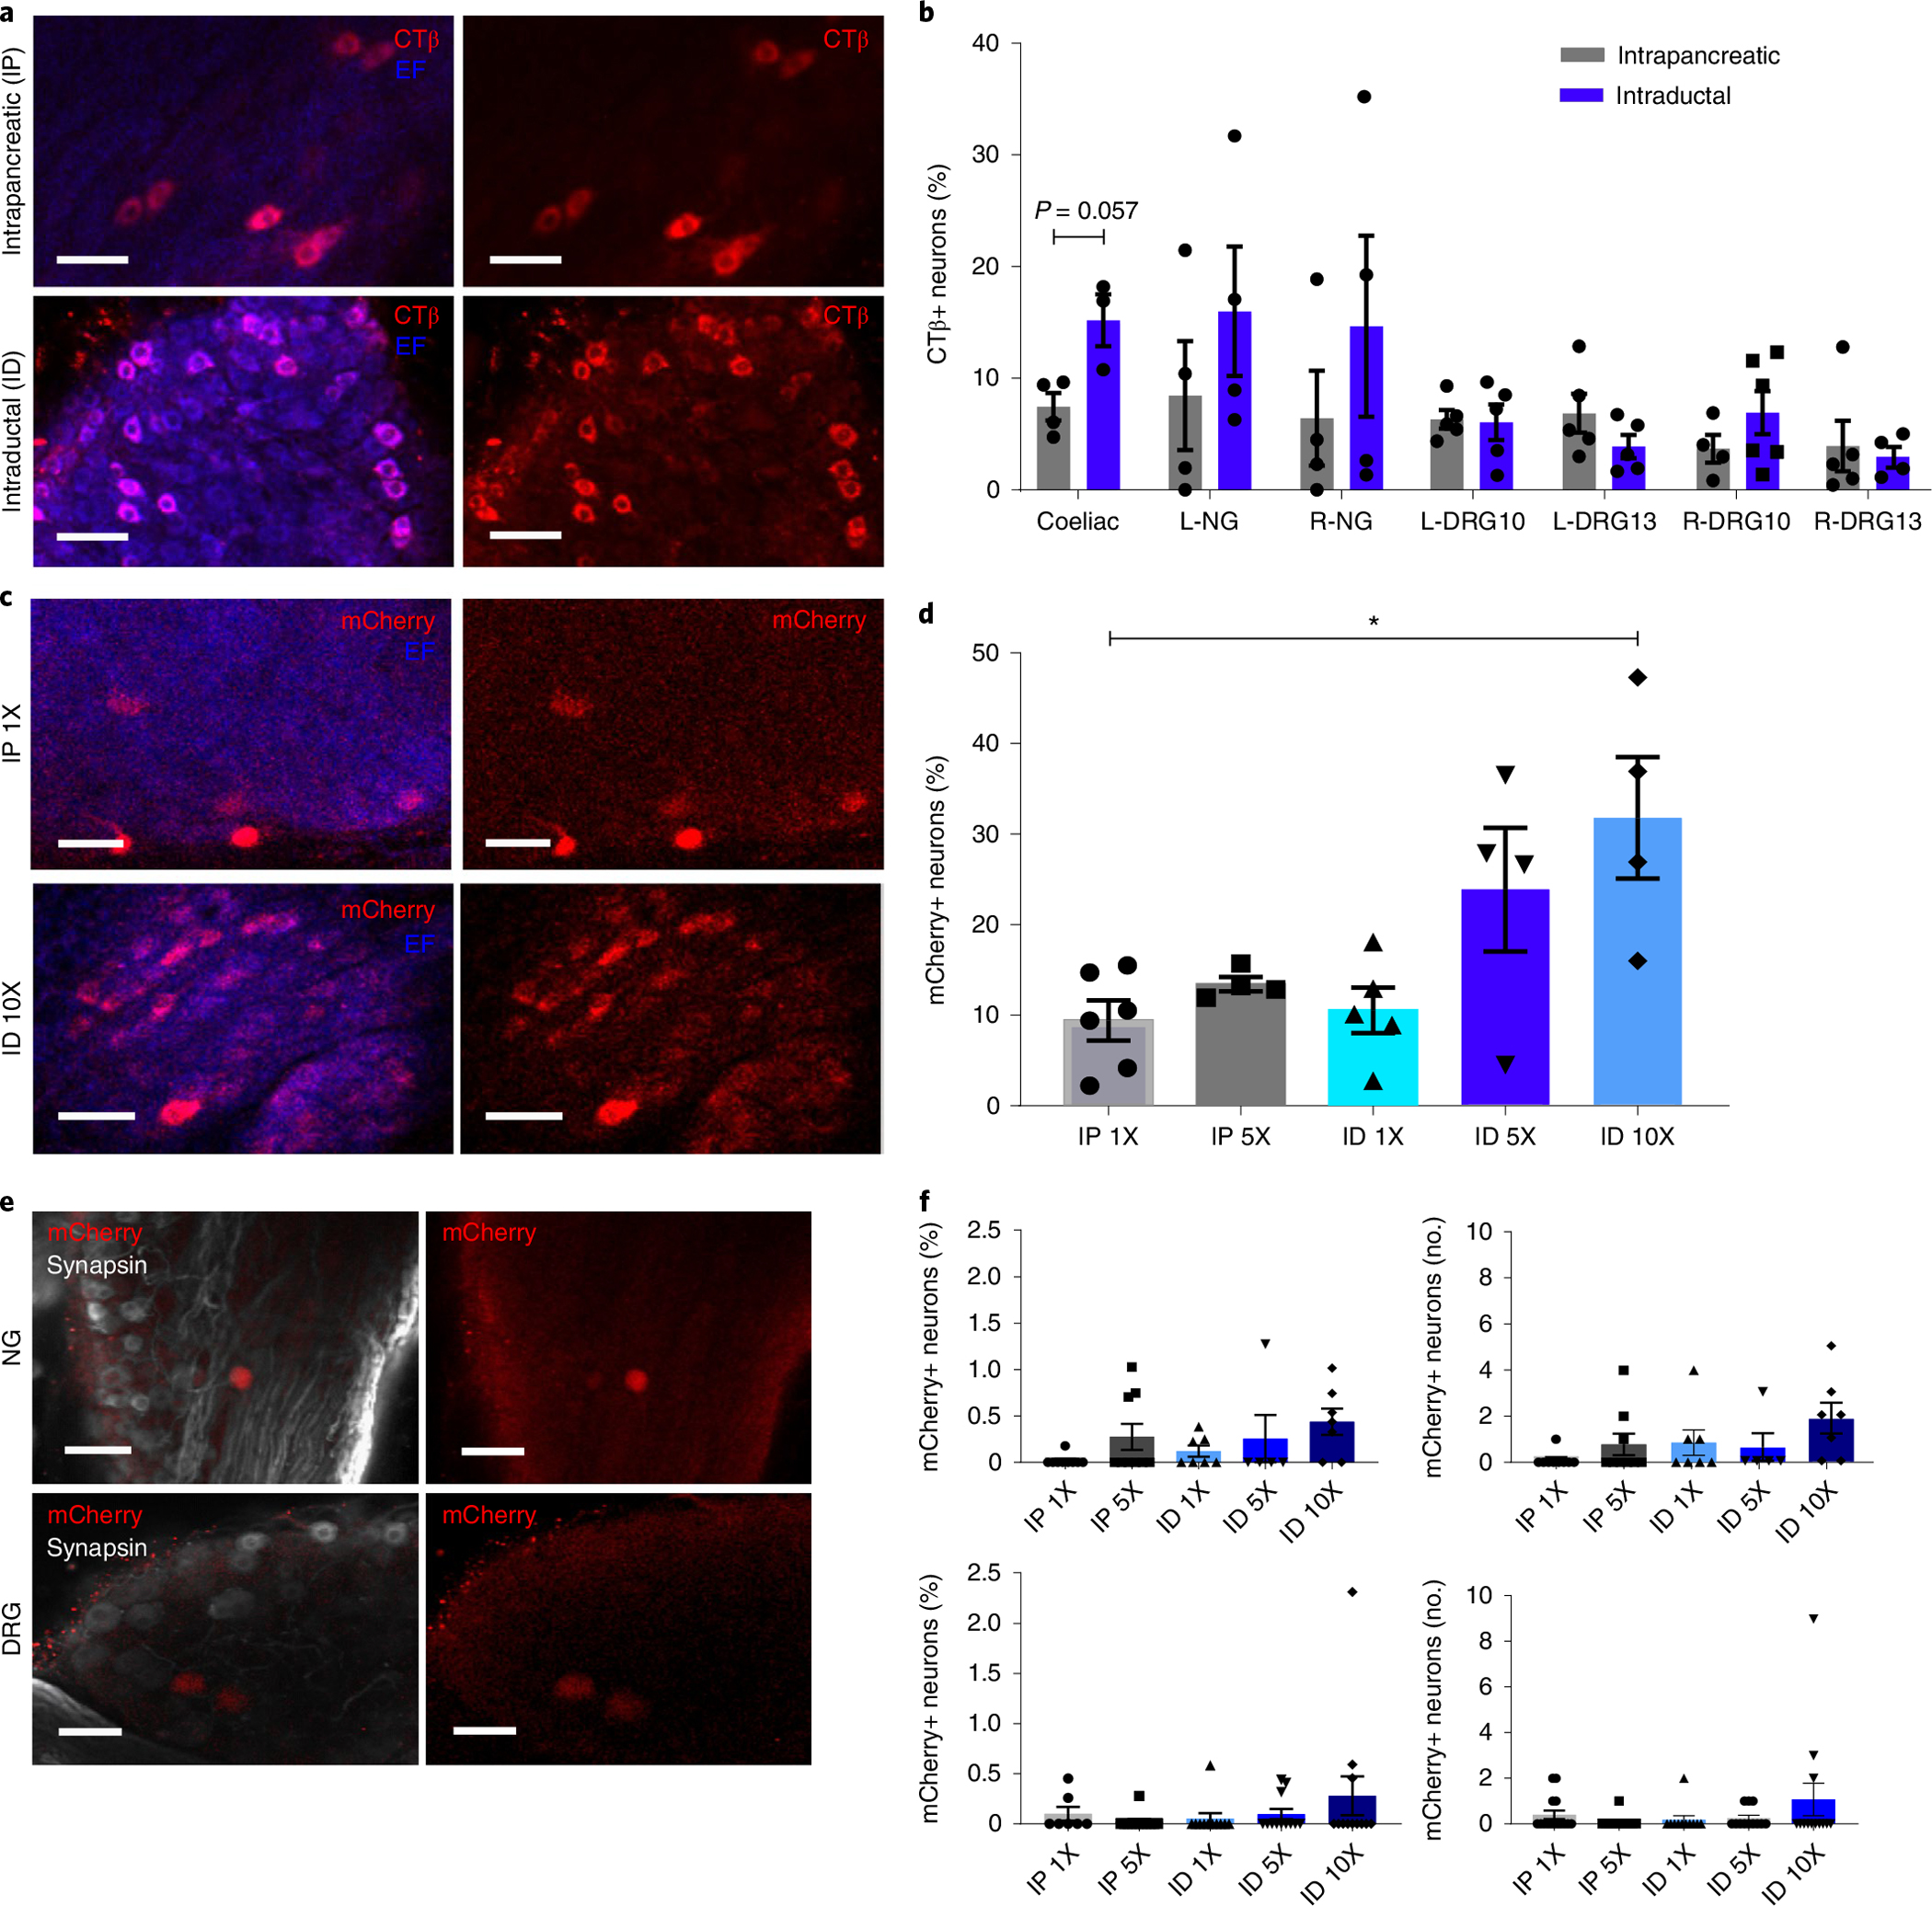
Fig. 3 |. Optimization of gene delivery.

a, Images of CTβ+ neurons in iDISCO+ cleared CG after CTβ delivery by IP injection (top) or ID infusion (bottom). Scale bars, 50 μm. Left, CTβ+ neurons (red) and endogenous fluorescence (EF, blue); right, CTβ+ neurons (red) alone. b, Quantification of CTβ neurons in peripheral ganglia after IP or ID delivery (percentage of total neurons). c, Images of mCherry+ neurons in iDISCO+ cleared CG after AAV8-hSyn-mCherry delivery (top: IP, dose 1X, 1 × 10¹¹ vg; bottom: ID, dose 10X, 1X 1 × 1012 vg). Scale bars, 50 μm. d, Quantification of mCherry+ pancreas-innervating neurons in CG after AAV8-hSyn-mCherry delivery (IP doses: 1X, 1 × 10¹¹ vg; 5X, 5 × 10¹¹ vg; ID doses: 1X, 1 × 10¹¹ vg; 5X, 5 × 10¹¹ vg; 10X, 1X 1 × 1012 vg) (percentage of total neurons). e, Images of mCherry+ neurons in NG and DRG after AAV8-hSyn-mCherry delivery (ID dose 10X). Scale bars, 100 μm. f, Quantification of mCherry+ neurons in NG (top) and DRG (bottom) after AAV8-hSyn-mCherry delivery (IP doses: 1X, 1 × 10¹¹ vg; 5X, 5 × 10¹¹ vg; ID doses: 1X, 1 × 10¹¹ vg; 5X, 5 × 10¹¹ vg; 10X, 1X 1 × 1012 vg) (left: percentage of total neurons; right: total number per ganglion). All data represented as mean ± SEM. Biologically independent samples: for b, intrapancreatic: N = 4 samples each for CG, L-NG, R-NG, L-DRG13 and R-DRG-10, and 5 samples each for L-DRG10 and R-DRG13. Intraductal: N = 3 samples for CG, 4 samples each for L-NG, R-DRG10 and R-NG, 5 samples each for L-DRG10 and L-DRG13, and 6 samples for R-DRG13. For d: N = 6 samples for IP1X, 4 each for IP5X, ID5X and ID10X, and 5 for ID1X. For f, top: N = 9 samples each for IP1X and IP5X, 7 each for ID1X and ID10X, and 5 for ID5X. Bottom: N = 7 samples for IP1X, 12 each for IP5X and ID10X, and 11 for ID1X. Statistical analyses are described in Supplementary Table 2.
