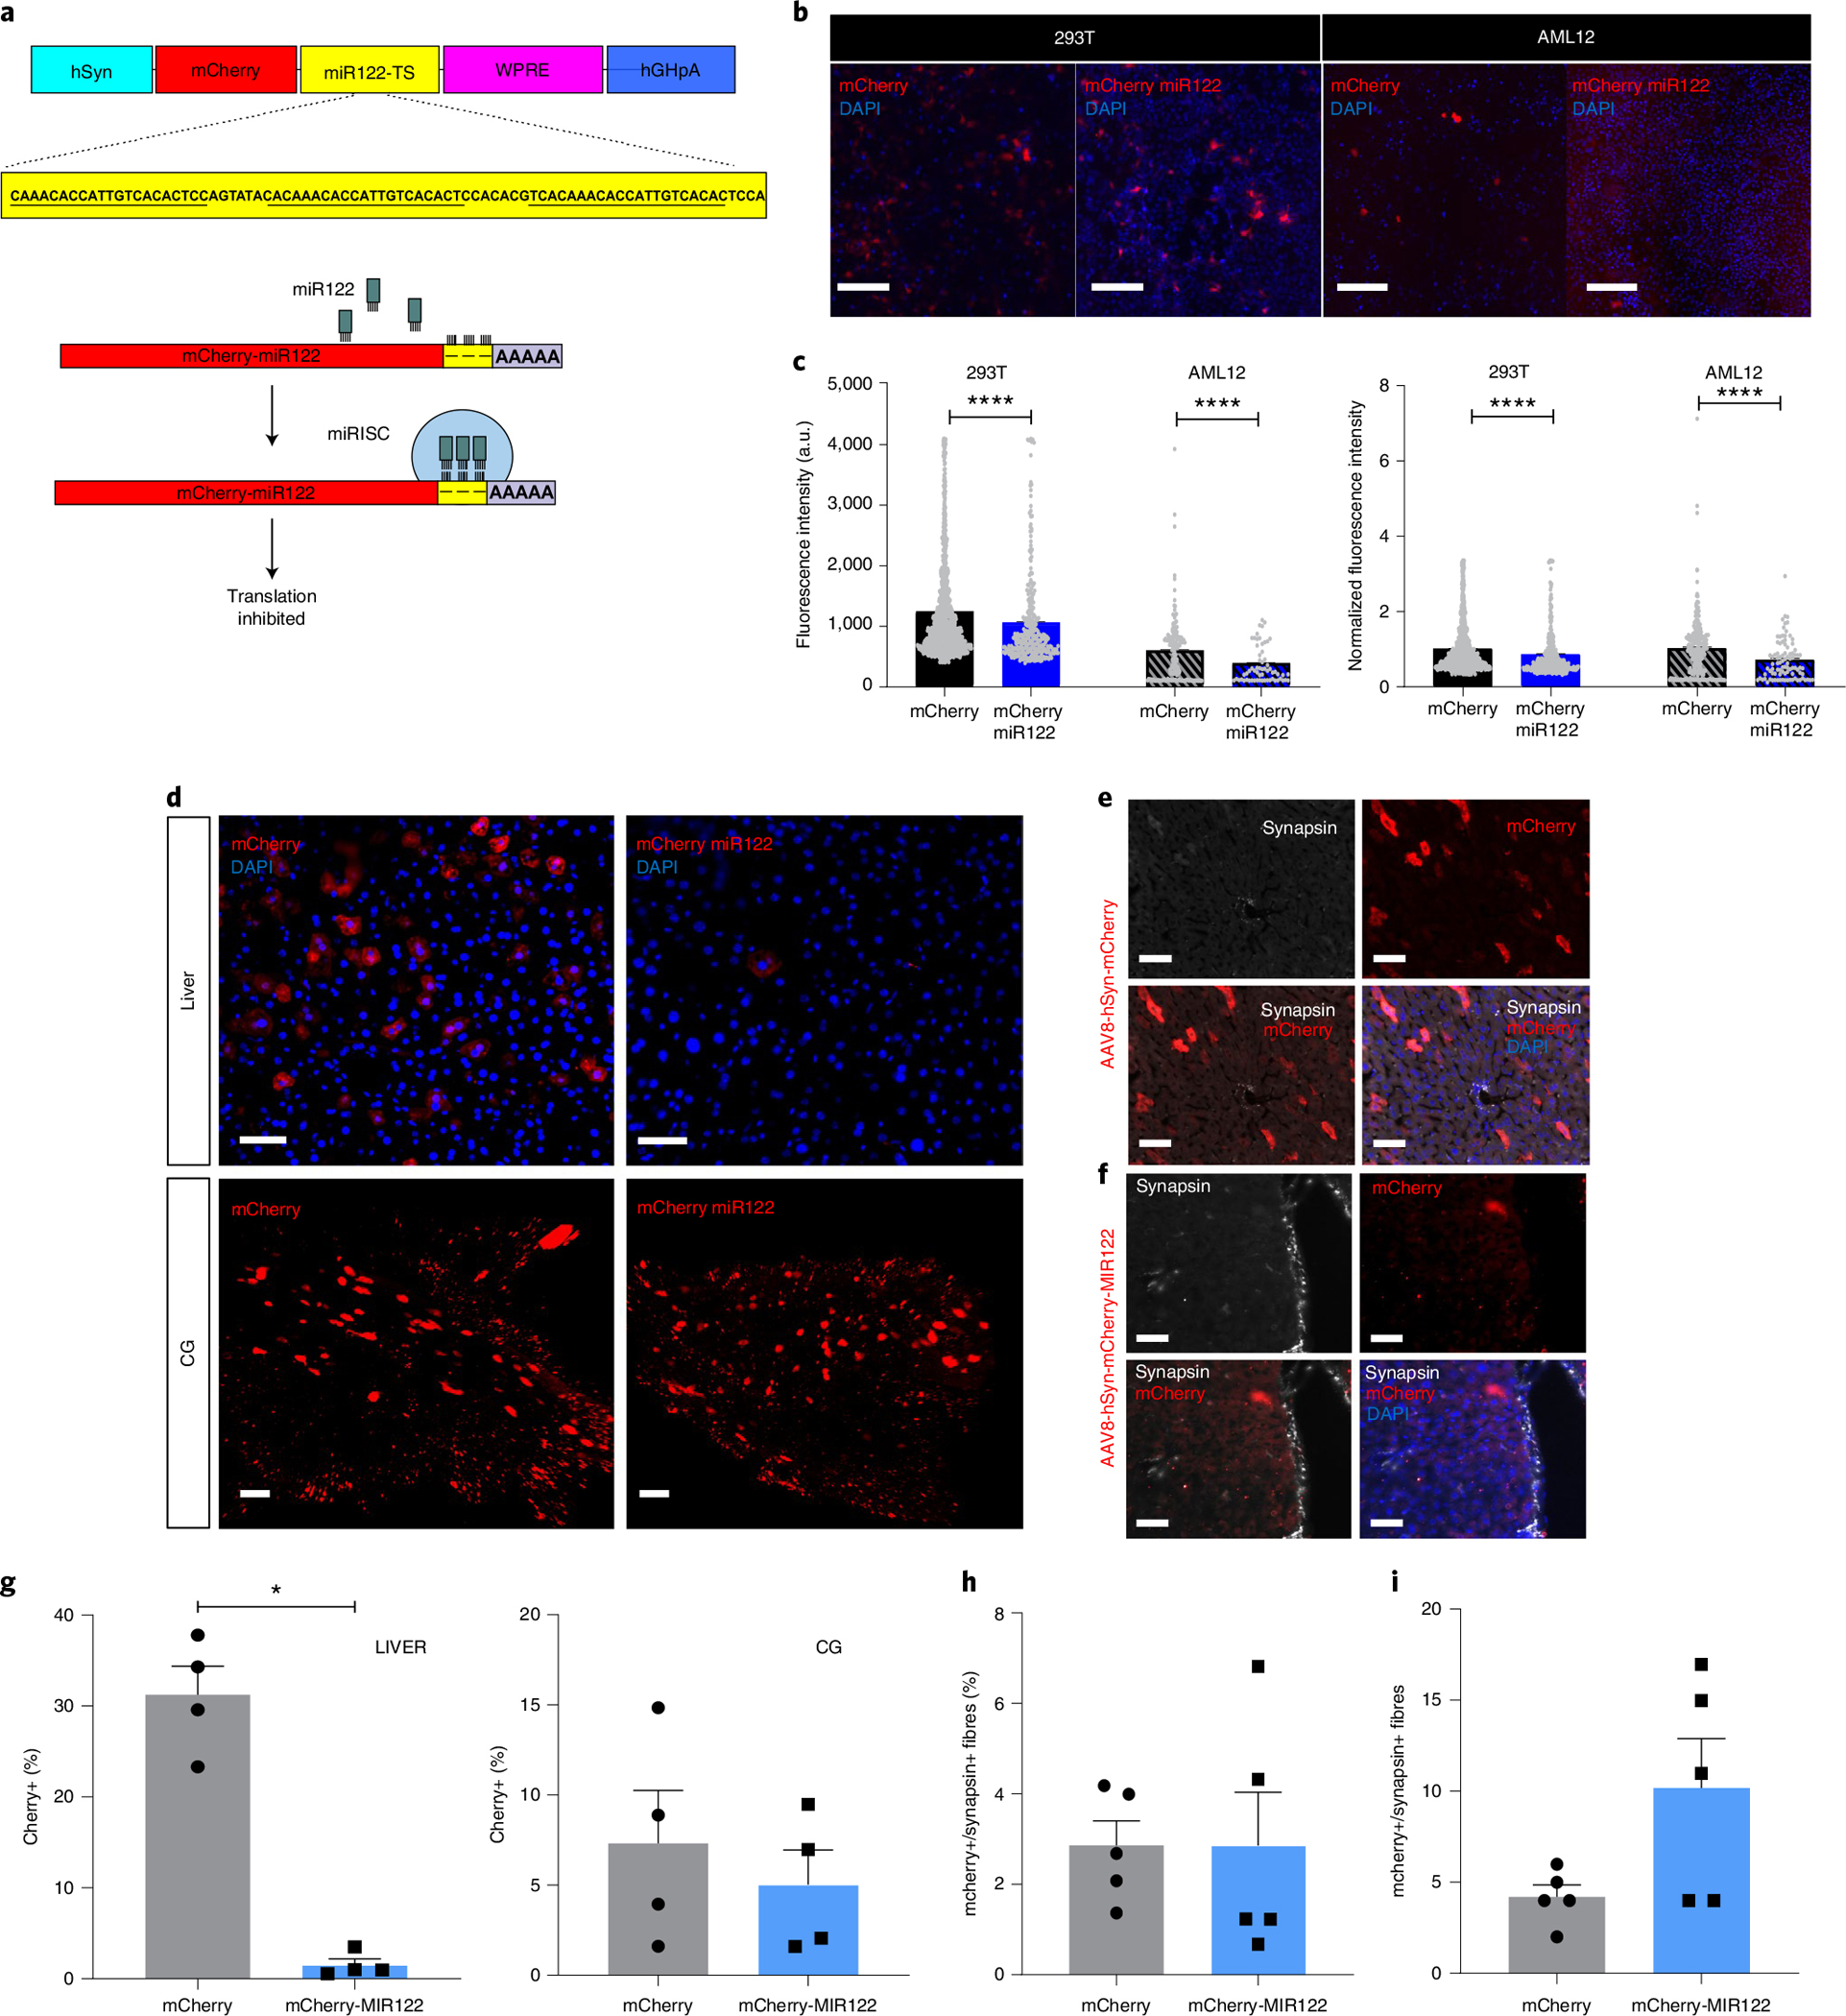
Fig. 4 |. Combined strategy for restricted gene expression in pancreatic innervation.

a, Schematic representation of liver-detargeting construct showing hSyn promoter, mCherry fluorescent protein, miR122 target site (miR122TS) in triplicate, woodchuck hepatitis virus post-transcriptional regulatory element (WPRE) and human growth hormone polyA (hGHpA). b, Representative immunofluorescence images of HEK293T (293T) and AML12 clonal cells after transfection with phSyn-mCherry and phSyn-mCherry-miR122TS (red). DAPI in blue. Scale bars, 200 μm. c, Quantification of absolute (left) and relative (right) fluorescence intensity of mCherry+ cells in transfected 293T and AML12 clonal cells. d, Representative immunofluorescence images of liver sections (top) and maximum projection of confocal images of mCherry+ pancreas-innervating neurons in CG (bottom), 4 weeks after intrapancreatic injection of AAV8-hSyn-mCherry (left) or AAV8-hSyn-mCherry-miR122TS (right). Scale bars, 25 μm for liver sections; 100 μm for CG. e, Representative immunofluorescence images of liver sections 4 weeks after intrapancreatic injection of AAV8-hSyn-mCherry, stained for mCherry (red) and synapsin (white), showing no overlap of mCherry+ off-target expression with synapsin+ fibres. Scale bar, 50 μm. f, Representative immunofluorescence images of liver sections 4 weeks after intrapancreatic injection of AAV8-hSyn-mCherry-miR122TS, stained for mCherry (red) and synapsin (white), showing a decrease in mCherry expression and no overlap mCherry+ off-target expression with synapsin+ fibres. Scale bar, 50 μm. g, Quantification of the percentage of mCherry+ cells in liver sections (left) and CG (right). h, Quantification of % mCherry+ in synapsin+ fibres. i, Raw overlap quantification of mCherry+ and synapsin+ fibres. All data represented as mean ± SEM. Statistical analyses are described in Supplementary Table 2.
