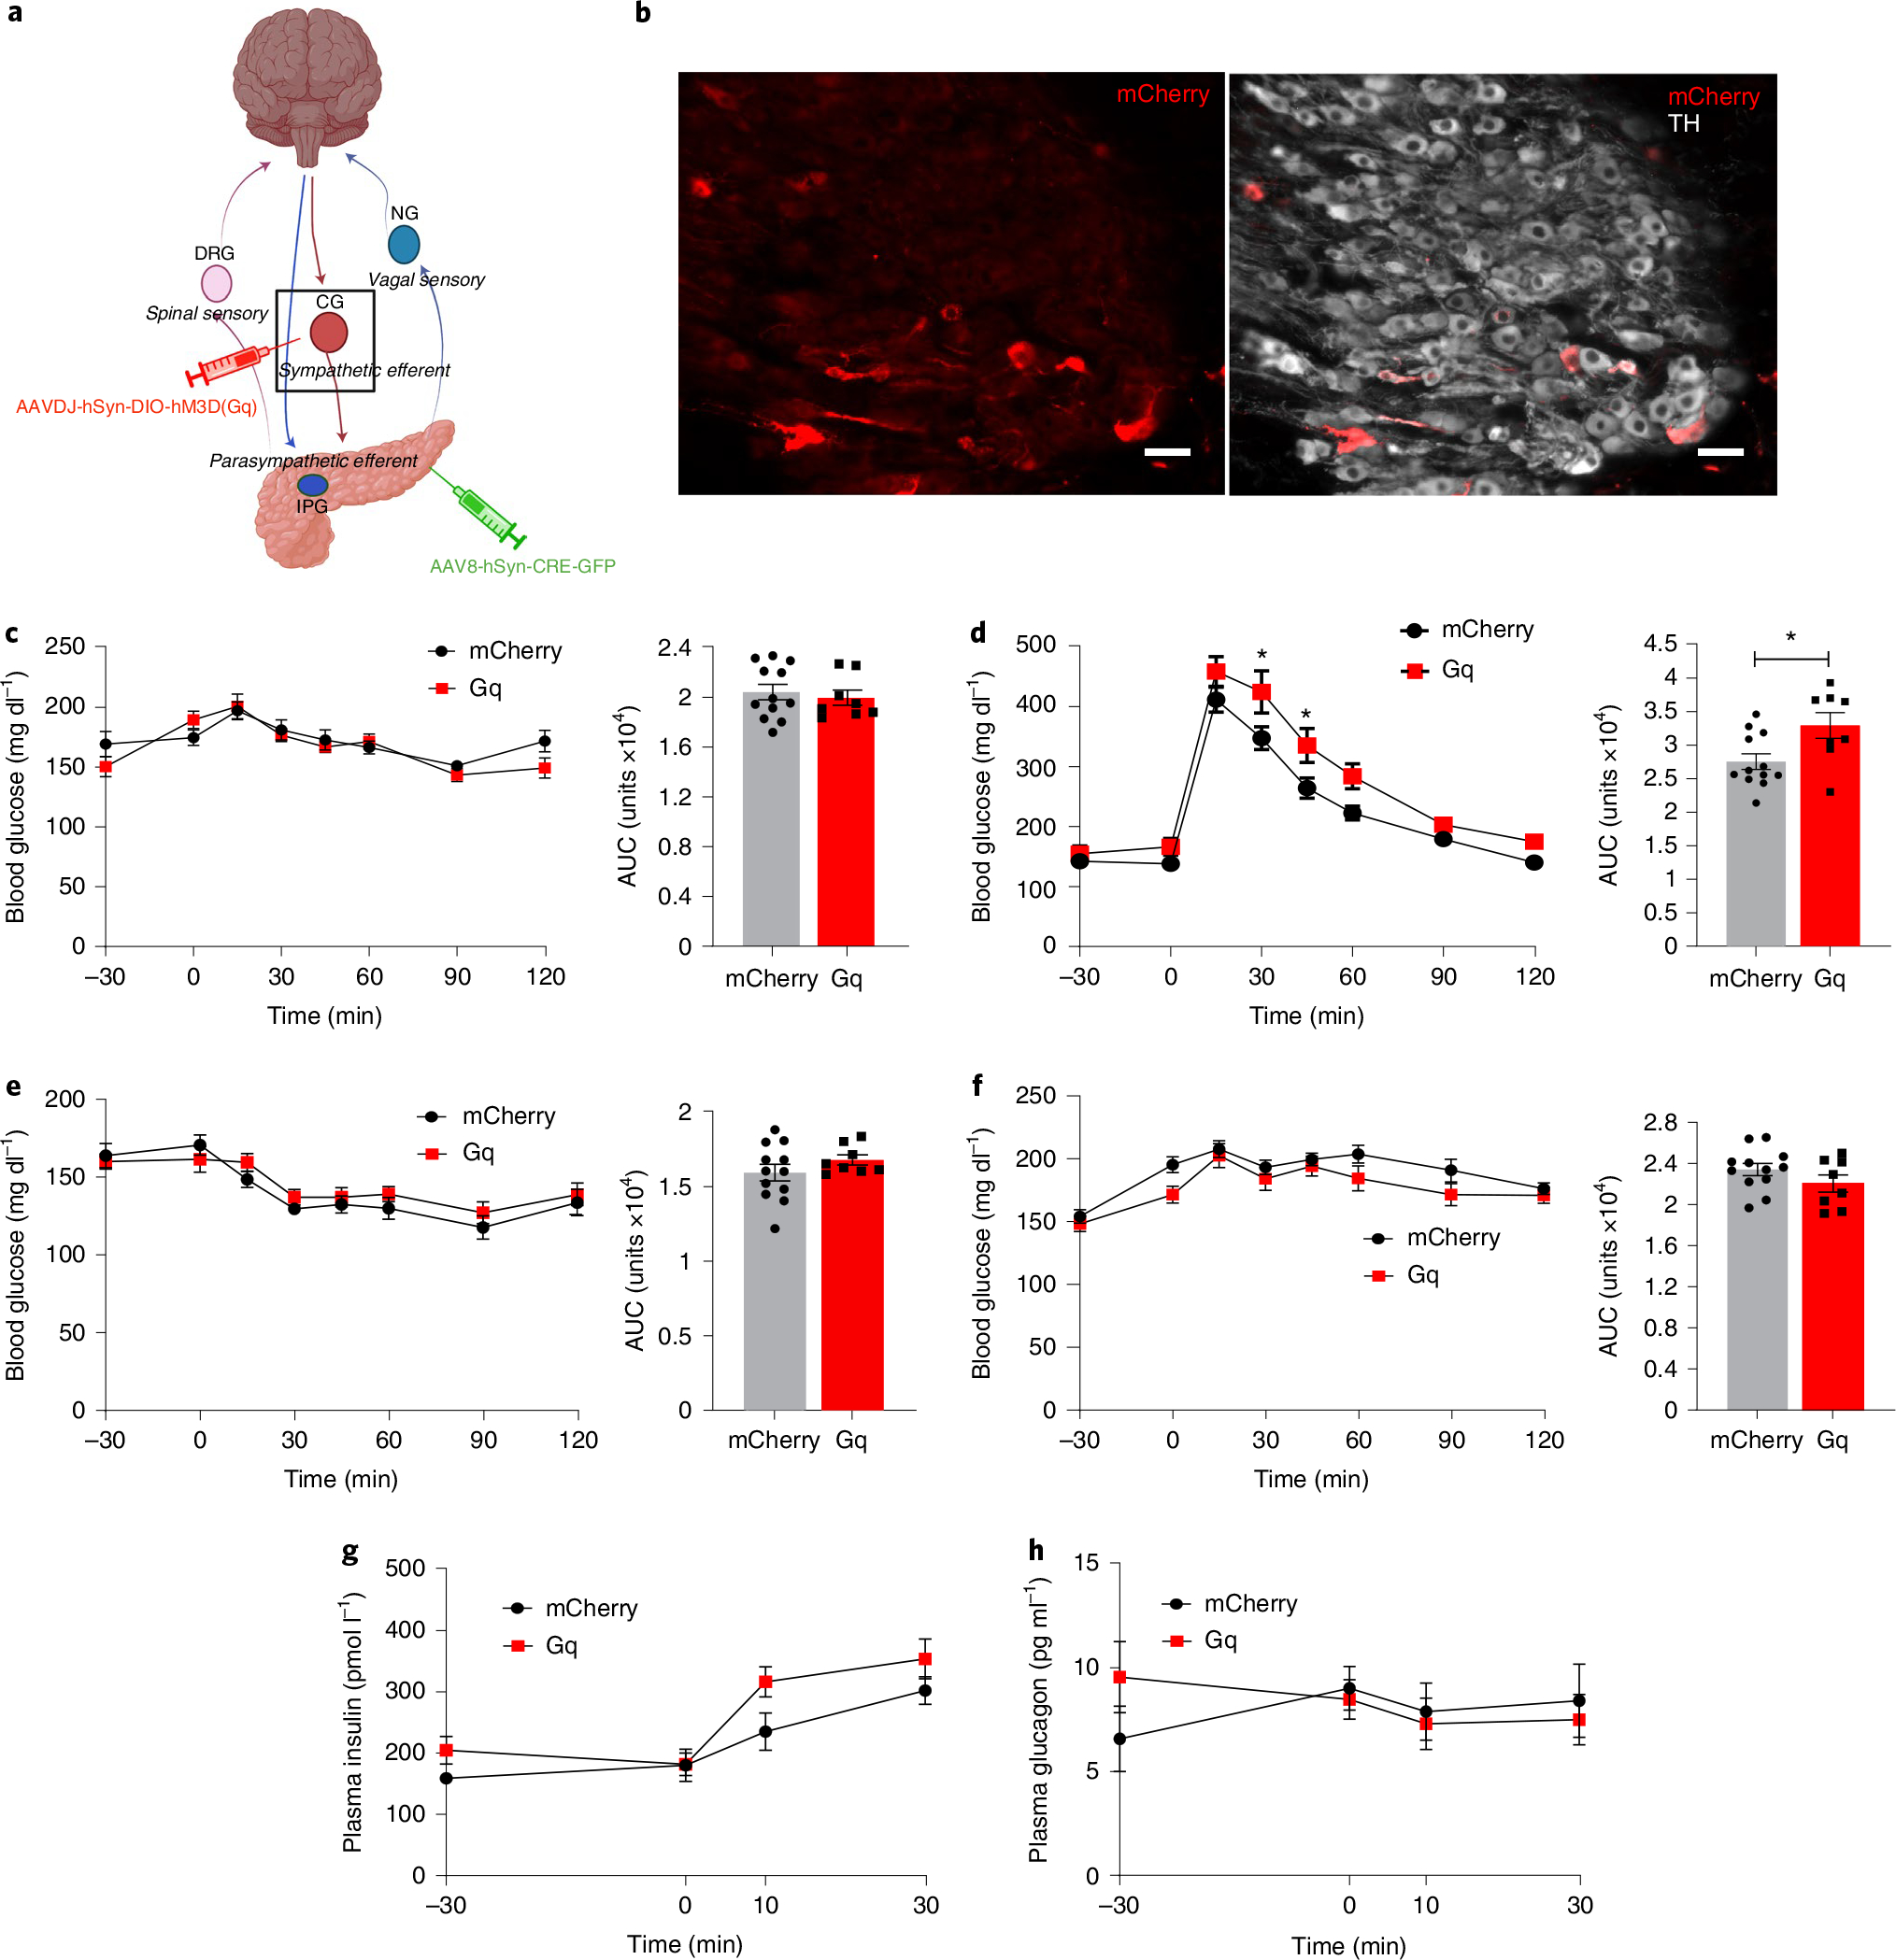
Fig. 7 |. Pancreatic sympathetic activation impairs glucose homoeostasis.

a, Schema of pancreas-projecting sympathetic neurons in CG. b, Images of mCherry expression in sympathetic pancreas-projecting neurons in the CG (TH, white) after intracoeliac injection of AAVdj-hSyn-DIO-hM3D(Gq)-mCherry and intrapancreatic injection of AAV8-hSyn-CRE-eGFP. Scale bar, 50 μm. c, Left: blood glucose in CNO-treated (i.p., 3 mg kg−1) AAVdj-hSyn-DIO-hM3D(Gq)-mCherry/AAV8-hSyn-CRE-eGFP mice (N = 8) compared to CNO-treated AAV8-hSyn-DIO-mCherry/AAV8-hSyn-CRE-eGFP mice (N = 12) after 6 h fasting. Right: cumulative blood glucose change (AUC, 0 min to 120 min). d, Left: blood glucose during GTT in CNO-treated (i.p., 3 mg kg−1 at −30 min) AAVdj-hSyn-DIO-hM3D(Gq)-mCherry/AAV8-hSyn-CRE-eGFP mice (N = 8) compared to CNO-treated AAV8-hSyn-DIO-mCherry/AAV8-hSyn-CRE-eGFP mice (N = 12) after 6 h fasting. Right: cumulative blood glucose change (AUC, 0 min to 120 min). e, Left: blood glucose during insulin tolerance test (i.p., 0.25 U kg−1) in CNO-treated AAVdj-hSyn-DIO-hM3D(Gq)-mCherry/AAV8-hSyn-CRE-Egfp mice (N = 8) compared to CNO-treated AAV8-hSyn-DIO-mCherry/AAV8-hSyn-CRE-eGFP mice (N = 12) without fasting. Right: cumulative blood glucose change (AUC, 0 min to 120 min). f, Left: blood glucose during pyruvate tolerance test (i.p., 1 g kg−1) in CNO-treated AAVdj-hSyn-DIO-hM3D(Gq)-mCherry/AAV8-hSyn-CRE-eGFP mice (N = 8) compared to CNO-treated AAV8-hSyn-DIO-mCherry/AAV8-hSyn-CRE-eGFP mice (N = 12) without fasting. Right: cumulative blood glucose change (AUC, 0 min to 120 min). g, Plasma insulin during GTT at −30, 0, 10 and 30 min (AAVdj-hSyn-DIO-hM3D(Gq)-mCherry/AAV8-hSyn-CRE-eGFP mice (N = 8), AAV8-hSyn-DIO-mCherry/AAV8-hSyn-CRE-Egfp mice (N = 12)). h, Plasma glucagon during GTT at −30, 0, 10 and 30 min (AAVdj-hSyn-DIO-hM3D(Gq)-mCherry/AAV8-hSyn-CRE-eGFP mice (N = 8), AAV8-hSyn-DIO-mCherry/AAV8-hSyn-CRE-Egfp mice (N = 9)). All data represented as mean ± SEM. Individual data points represent individual mice. Statistical analyses are described in Supplementary Table 2. Figure 7a was created with BioRender.com.
