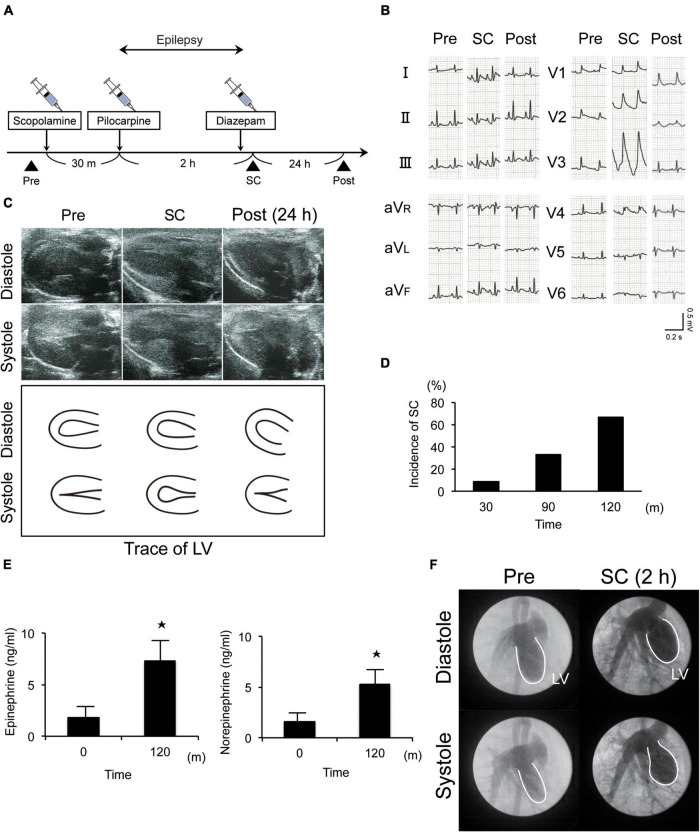
FIGURE 1.
New animal model of epilepsy-induced stress cardiomyopathy (SC). (A) Protocol for the induction of SC in Wistar rats using pilocarpine. (B) Electrocardiograms revealing typical ST elevation during SC. Pre, pre-inducing epilepsy; Post, post-inducing epilepsy; (C,F) Echocardiography (c) and left ventriculography (F) revealed that wall motion of the left ventricle (LV) apical segment was akinetic or dyskinetic during SC. (D) Incidence of epilepsy-induced SC (n = 9). (E) Upregulated serum epinephrine, norepinephrine, and dopamine levels 2 h after the induction of epilepsy (n = 4). Where appropriate, data are provided as the mean ± SD. *P < 0.05 compared with 0 min (E).

