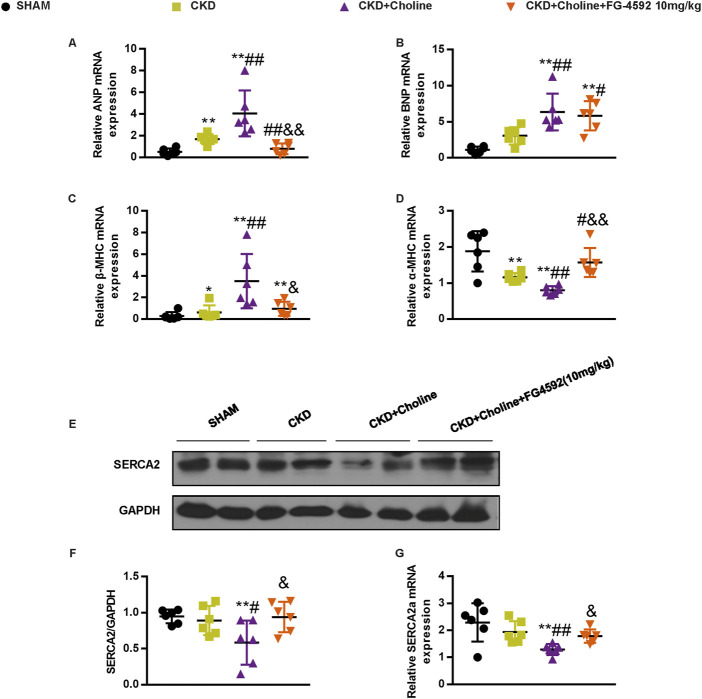
FIGURE 9.
FG-4592 inhibits the changes of cardiac hypertrophy markers and SERCA2 expression in 5/6 Nx mice on a high-choline diet. (A–D) The mRNA levels of ANP, BNP, β-MHC, and α-MHC were measured by real-time PCR. (E) The protein levels of SERCA2 were measured by western blotting. (F) Graphic representation of relative abundance of SERCA2 normalized to GAPDH. (G) The mRNA levels of SERCA2 were measured by real-time PCR. The data are presented as the mean ± SD. * p < 0.05 and ** p < 0.01 vs. SHAM group; # p < 0.05 and ## p < 0.01 vs. CKD group; & p < 0.05 and && p < 0.01 vs. CKD + Choline group. n = 6 in each group.

