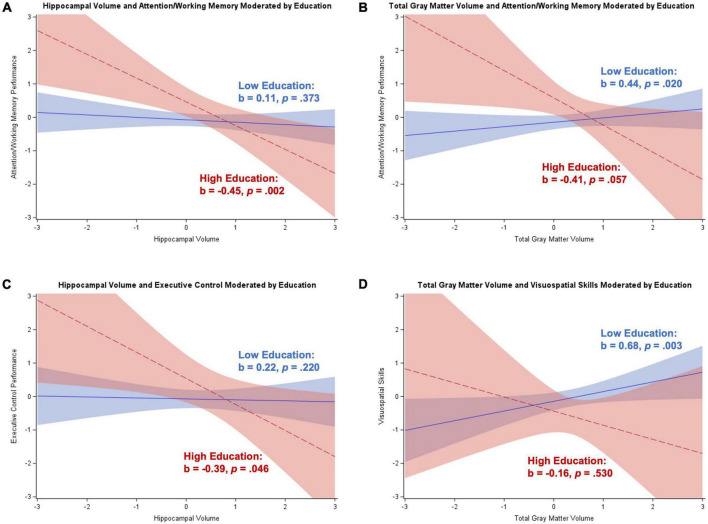
FIGURE 8.
Plots of significant moderations by education of the associations between brain volume and cognition for women with dementia. High education corresponds to 1 SD above the mean and low education corresponds to 1 SD below the mean. The red dotted line represents high education, and the blue solid line represents low education. Shaded areas represent 95% confidence intervals. Cognition and brain volume were standardized. (A) Significant negative association between hippocampal volume and attention/working memory for participants with high education; non-significant positive association for low education. (B) Non-significant negative association between total gray matter volume and attention/working memory for participants with high education; significant positive association for low education. (C) Significant negative association between hippocampal volume and executive control for participants with high education; non-significant positive association for low education. (D) Non-significant negative association between total gray matter volume and visuospatial skills for participants with high education; significant positive association for low education.

