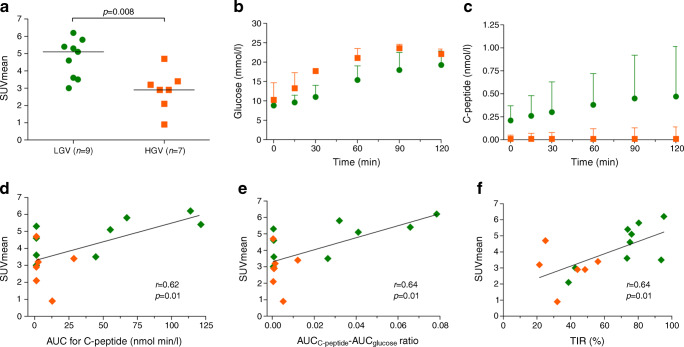
Fig. 1.
Analysis of MMTT and PET/CT data. SUVmean of the pancreas (a) in individuals with LGV (green) and HGV (orange). Glucose (b) and C-peptide profiles (c) for both groups, median (IQR). Correlations of the SUVmean with the AUC for C-peptide (d), the AUCC-peptide:AUCglucose ratio (e) and with the percentage TIR (f). Two participants from the HGV group have a SUVmean of 2.90 and no detectable C-peptide and their data points are in the same location (d and e). CGM data of one participant from the HGV group were not available at the time of analysis and only six data points from this group are visualised (f)

