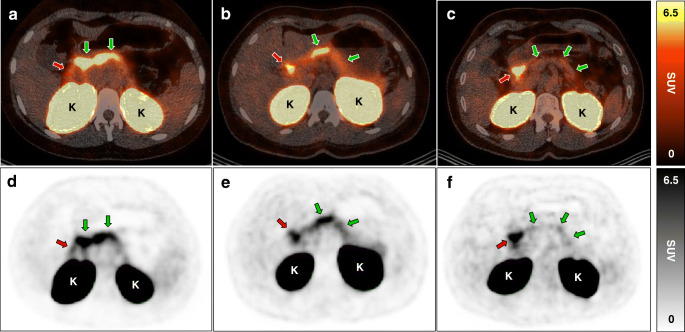
Fig. 2.
Abdominal PET/CT images with pancreatic uptake of radiolabelled exendin. Transversal fused PET/CT images (a–c) and PET images (d–f) of three individuals showing pancreatic uptake of 68Ga-exendin as measure for beta cell mass (green arrows). Other regions with exendin uptake are the proximal duodenum (red arrows) and the kidneys (indicated with the letter ‘K’). Pancreatic exendin uptake of individuals with LGV were in the same range for individual 1 (a, d) (AUC for C-peptide 122 nmol min/l) and individual 2 (b, e) (no detectable C-peptide), despite differences in C-peptide response, and much greater than in individual 3 (c, f) (no detectable C-peptide)

