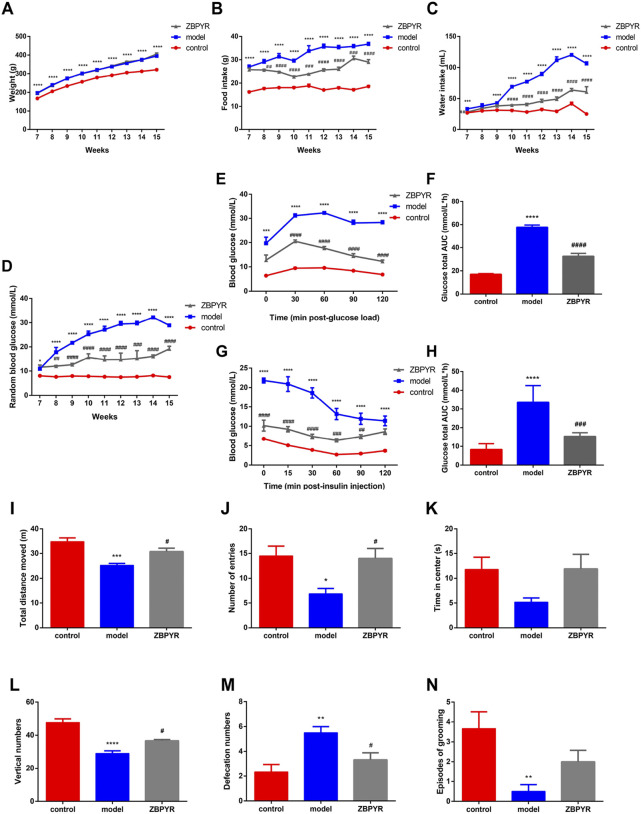
FIGURE 1.
Effects of ZBPYR on physiological parameters, RBG, OGTT, ITT, and exploratory behavior. (A–C) Effects of ZBPYR on body weight (A), food intake (B), and water intake (C). These physiological paramete were measured daily at 7–15 weeks old. (D–H) Effects of ZBPYR on RBG, OGTT, and ITT. RBG (D) was measured at 7–15 weeks of age. Line charts show the levels of blood glucose in the OGTT (E) and ITT (G), respectively. Histograms show the total glucose area under the curve (AUC) in the OGTT (F) and ITT (H), respectively. (I–N) Effect of ZBPYR on activities in the open-field test. Total distance (I), number of entries (J), time in center (K), vertical numbers (L), defecation numbers (M), and episodes of grooming (N) were measured. *p < 0.05, **p < 0.01, ***p < 0.001, ****p < 0.0001, model vs. control; #p < 0.05, ##p < 0.01, ###p < 0.001, ####p < 0.0001, ZBPYR vs. model (mean ± SEM, n = 6 per group).

