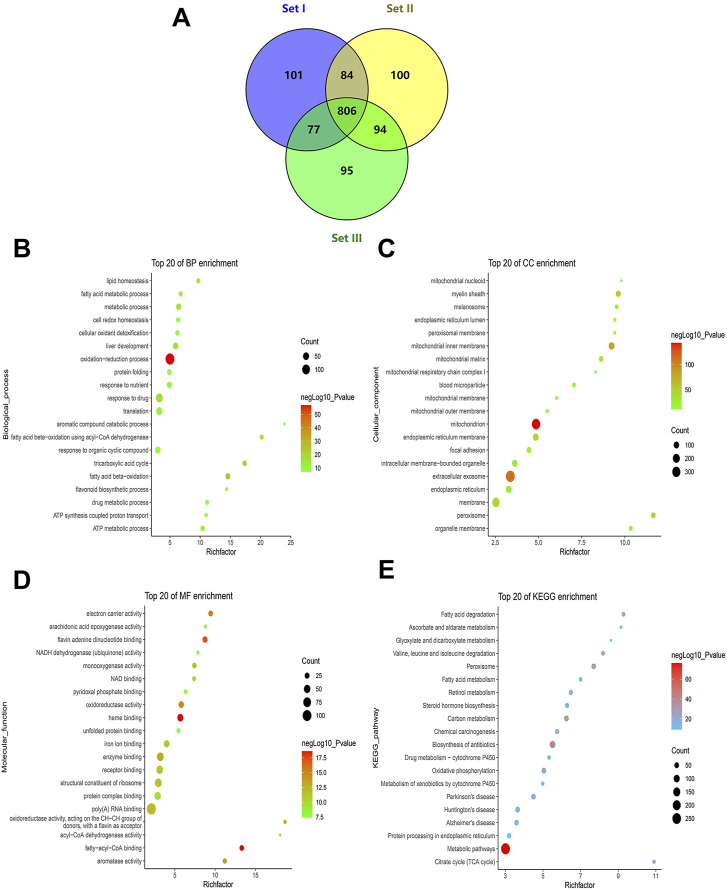
FIGURE 3.
Profile of quantitative MAM proteins identified in the liver. (A) Venn diagram of the number of non-redundant proteins in technical triplicate analysis. (B–D) Profile of GO enrichment analysis of the quantitative proteins, including biological process (BP), cellular component (CC), and molecular function (MF). Bubble charts show the terms of BP (B), CC (C), and MF (D), respectively. (E) A bubble chart showing terms of the KEGG pathway. The top 20 terms sorted by p-values for each category are displayed, with the y-axis showing the categories (BP, CC, MF, and KEGG) and the x-axis showing the rich factor (rich factor = number of DEPs enriched in the categories/number of all proteins in background protein set). The color and size of bubbles indicate the significance of enrichment and the number of DEPs enriched in the categories, respectively.

