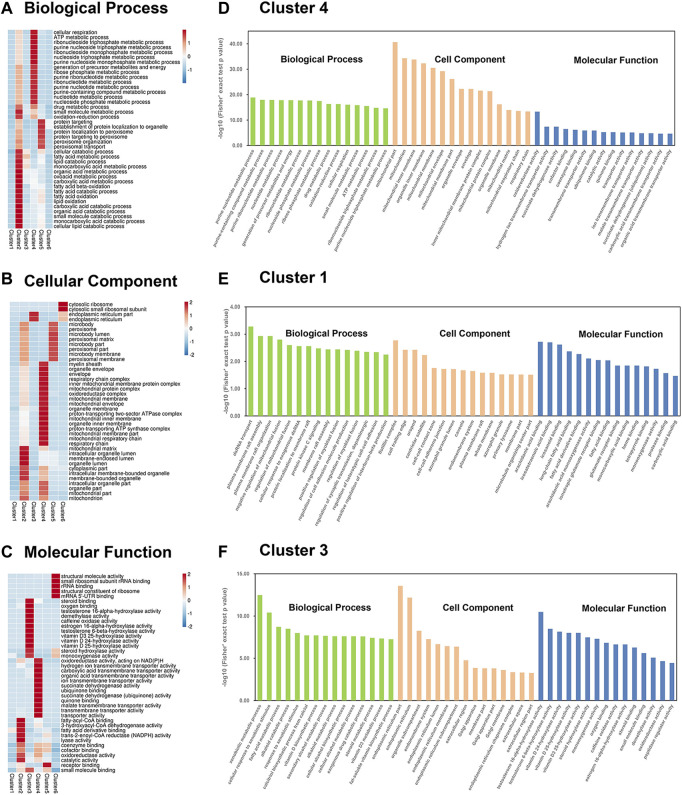
FIGURE 4.
Enrichment based on Mfuzz clustering by three GO annotations. (A–C) Three GO annotated heatmaps of proteins were obtained: (A) BP, (B) CC, and (C) MF, with altered expression levels among the six Mfuzz clustering groups. The heatmap scale is based on Z scores ranging from −2/−1 (blue) to 1/2 (red), with a midpoint of 0 (white). (D–F) GO-based enrichment analysis is divided into cluster 1 (D), cluster 4 (E), and cluster 3 (F). The BP, CC, and MF are labeled in green, orange, and blue, respectively.

