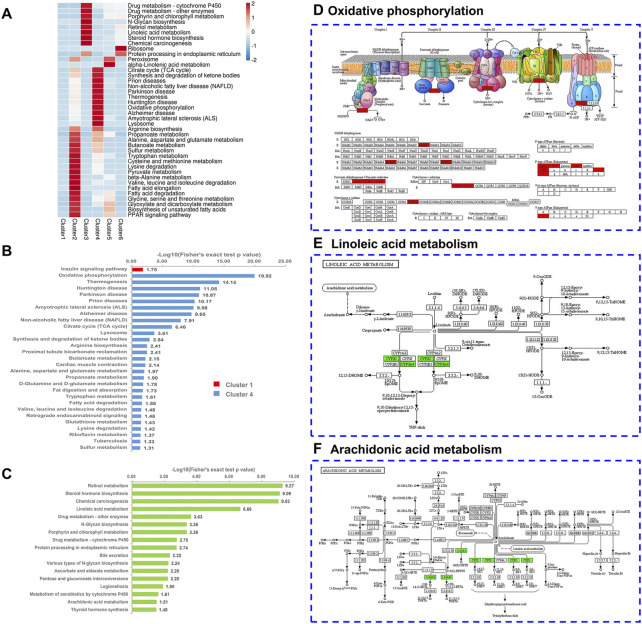
FIGURE 5.
KEGG pathway enrichment based on Mfuzz clustering. (A) Heatmap of KEGG pathway enrichment. The heatmap scale is based on Z scores ranging from −2 (blue) to 2 (red) with a midpoint of 0 (white); p-value < 0.05. (B,C) KEGG pathway-based enrichment analysis is divided into two subgraphs: cluster 1 and cluster 4 (B), and cluster 3 (C). Cluster 1, cluster 4, and cluster 3 are represented in red, blue, and green, respectively. (D–F) Characteristic KEGG pathways with cluster 3 and 4 proteins were obtained. Cluster 4 proteins are labeled in red on the oxidative phosphorylation (OXPHOS) map (D). Cluster 3 proteins are marked in green on both the linoleic acid map (E) and the arachidonic acid map (F).

