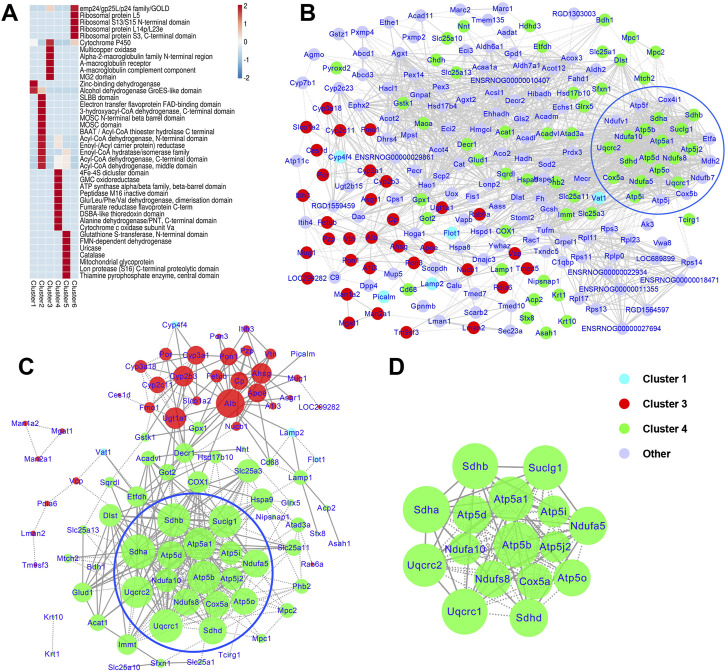
FIGURE 6.
Protein domain enrichment analyses and protein-protein interaction (PPI) analysis of DEPs. (A) Protein domain enrichment analyses based on Mfuzz clustering. The heatmap scale is based on Z scores ranging from −2 (blue) to 2 (red) with a midpoint of 0 (white); p-value < 0.05. (B) PPI maps of the DEPs in the control, model, and ZBPYR groups. (C,D) PPI network and modules of cluster 1, 3, and 4 proteins. PPI (C) and modules (D) are proteins associated with the administration of T2DM under chronic psychological stress and ZBPYR treatment. The blue nodes belong to cluster 1, the red nodes belong to cluster 3, the green nodes be a part of cluster 4, and the purple nodes are the other DEPs. The sizes of the nodes reflect the node degree.

