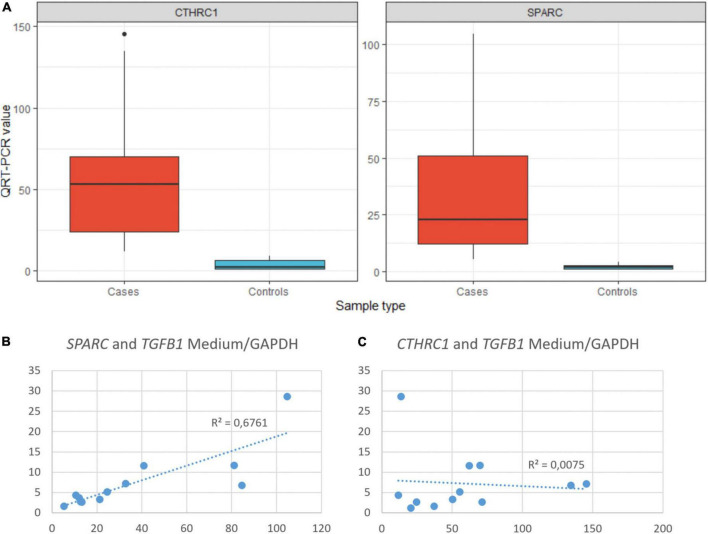
FIGURE 6.
(A) Statistical differences in the expression of CTHRC1 and SPARC between COVID-19 (cases) and normal (controls) samples. T-test: CTHRC1 p = 0.0012, SPARC p = 0.0054. QRT-PCR units: ΔΔCt. (B) Correlation between the expression of SPARC and TGFβ1 in COVID-19 samples. (C) Correlation between the expression of CTHRC1 and TGFβ1 in COVID-19 samples.

