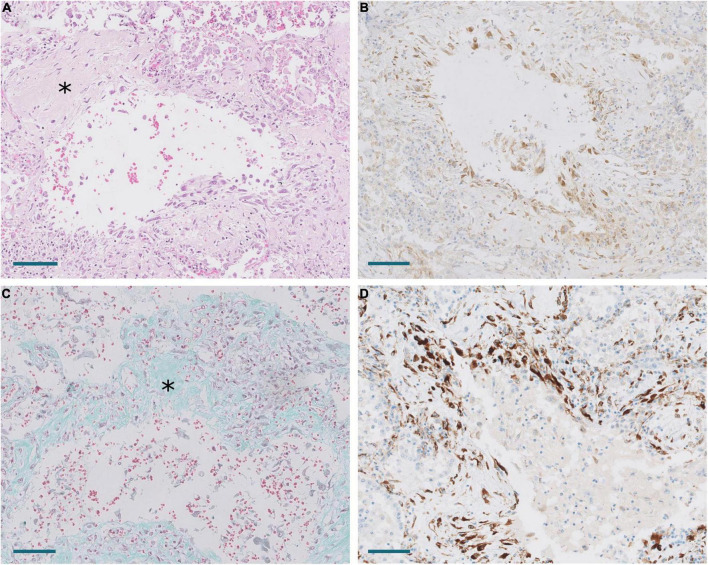
FIGURE 8.
Areas of periductal proliferation/fibrosis in Pt.18 with 43 days of disease evolution. (A) Hematoxylin and eosin. Note deposition of collagen (*). Scale bar: 100 μm. (B) Expression of CTHRC1. Scale bar: 100 μm. (C) Masson trichrome stain. Note collagen deposition in green (*). Scale bar: 100 μm. (D) SPARC expression. Scale bar: 100 μm.

