

Abstract
Iron (Fe) is an essential metal ion that plays a major role as a cofactor in many biological processes. The balance between the Fe2+ and Fe3+ forms is central for cellular Fe homeostasis because it regulates its transport, utilization, and storage. Contrary to Fe3+ reduction that is crucial for Fe uptake by roots in deficiency conditions, ferroxidation has been much less studied. In this work, we have focused on the molecular characterization of two members of the MultiCopper Oxidase family (MCO1 and MCO3) that share high identity with the Saccharomyces cerevisiae ferroxidase Fet3. The heterologous expression of MCO1 and MCO3 restored the growth of the yeast fet3fet4 mutant, impaired in high and low affinity Fe uptake and otherwise unable to grow in Fe deficient media, suggesting that MCO1 and MCO3 were functional ferroxidases. The ferroxidase enzymatic activity of MCO3 was further confirmed by the measurement of Fe2+‐dependent oxygen consumption, because ferroxidases use oxygen as electron acceptor to generate water molecules. In planta, the expression of MCO1 and MCO3 was induced by increasing Fe concentrations in the medium. Promoter‐GUS reporter lines showed that MCO1 and MCO3 were mostly expressed in shoots and histochemical analyses further showed that both promoters were highly active in mesophyll cells. Transient expression of MCO1‐RFP and MCO3‐RFP in tobacco leaves revealed that both proteins were localized in the apoplast. Moreover, cell plasmolysis experiments showed that MCO1 remained closely associated to the plasma membrane whereas MCO3 filled the entire apoplast compartment. Although the four knock out mutant lines isolated (mco1‐1, mco1‐2, mco3‐1, and mco3‐2) did not display any macroscopic phenotype, histochemical staining of Fe with the Perls/DAB procedure revealed that mesophyll cells of all four mutants overaccumulated Fe inside the cells in Fe‐rich structures in the chloroplasts, compared with wild‐type. These results suggested that the regulation of Fe transport in mesophyll cells had been disturbed in the mutants, in both standard condition and Fe excess. Taken together, our findings strongly suggest that MCO1 and MCO3 participate in the control of Fe transport in the mesophyll cells, most likely by displacing the Fe2+/Fe3+ balance toward Fe3+ in the apoplast and therefore limiting the accumulation of Fe2+, which is more mobile and prone to be transported across the plasma membrane.
Keywords: apoplast, chloroplast, ferroxidase, iron, multicopper oxidase, transport
1. INTRODUCTION
In the current conditions of the environment, Fe poses a real conundrum to most living organisms, because Fe is mainly found as the sparingly soluble (10−18 M) Fe3+ forms whereas the dynamic, highly mobile Fe2+ form is a strong pro‐oxidant, particularly in aerobic conditions. The redox cycling and equilibrium between Fe2+ and Fe3+ are therefore at the center of Fe homeostasis, regulating Fe uptake, storage, and utilization.
For many decades, most of the studies have been focused on the ferric reduction activities, because the mobilization of insoluble Fe3+ hydroxydes is the main limiting factor for Fe acquisition by plants. Most organisms express membrane‐bound Fe3+ reductases that belong either to the cytochrome b561 family (mammals) or to flavo‐cytochromes (fungi and plants). These ferrireductases are crucial for plant nutrition, to mobilize Fe and generate Fe2+ that is the substrate of both influx (i.e., IRT1, VIT1) and efflux (i.e., NRAMP3, NRAMP4, and ferroportin) membrane transporters (for a recent review, see Martin‐Barranco et al., 2021). In plants, the Fe3+ reductases identified so far belong to the FRO family. The best characterized member is FRO2, the Fe3+ reductase expressed at the root surface in conditions of Fe deficiency that is crucial for Fe uptake by roots (Robinson et al., 1999; Yi & Guerinot, 1996). Once in the cells, Fe transport into the chloroplasts also requires a Fe3+ reduction step that is catalyzed by FRO7 (Jeong et al., 2008), whereas FRO3 and FRO8 most likely contribute to Fe transport into mitochondria (Jeong & Connolly, 2009). However, alternative Fe3+ reduction systems do exist and participate in Fe transport. Recently, ascorbate was shown to participate directly in the transport of Fe between the maternal tissues of the seed and the embryo. It was shown that during seed development, embryos are able to efflux ascorbate, which will catalyze the reduction of Fe3+‐citrate‐malate complexes present in the surrounding endosperm, to generate Fe2+ that is taken up by the embryo (Grillet et al., 2014). Moreover, we have recently shown that during germination, the remobilization of the vacuolar Fe3+‐phytate complexes also requires a reduction step to generate Fe2+, the substrate of the efflux transporters NRAMP3 and NRAMP4. This ferric reduction requires the activity of a MATE transporter coded by AtDTX25, which loaded the vacuoles with ascorbate, to reduce Fe in that compartment (Hoang et al., 2021).
Contrary to Fe3+ reduction, in plants ferroxidation has received much less attention. In animals and humans, ceruloplasmin (Cp) (i.e., “the sky‐blue substance from plasma” due to the presence of several Cu atoms) was one of the first proteins and the first ferroxidase purified from plasma. The function of Cp, and the related protein haephestin (Hp), is to catalyze the oxidation of Fe2+, which is transported out of cells and into the plasma by ferroportin, to generate Fe3+ that will bind to transferrin, for its long‐distance trafficking toward the other organs of the body. Ferroxidases represent a small sub‐group within the family of multicopper oxidases (MCOs), and they perfectly illustrate the Cu/Fe inter‐dependence. The catalytic feature of ferroxidases is that they couple the one‐electron oxidation of four iron atoms with the four‐electron reduction of O2 into water (see reaction equation).
This capacity to reduce O2, without the generation of reactive O2 species (ROS), is a key enzymatic feature, especially for aerobes. Accordingly, MCOs are also considered as “terminal oxidases.” Multicopper oxidases also share a structural specificity, as they contain at least one of each of the three types of Cu sites: type one or “copper blue” (T1), type two (T2), comparable with the planar Cu complexes and the binuclear type three CuII‐CuII cluster (T3). Types 2 and 3 sites form a TriNuclear Center (TNC), which is the site of O2 reduction, whereas the T1 site is responsible for the oxidation of substrates and one‐electron transfer to the TNC. MCOs are generally considered rather promiscuous regarding their reducing substrates, which can be aromatic amines and polyphenols (for laccases), ascorbic acid (for ascorbate oxidases), and divalent metal ions (Fe2+, Cu2+, and even Mn2+ for ferroxidases) (Hoegger et al., 2006; Kosman, 2010; Quintanar et al., 2007). Since the substrate specificity is directly linked with the T1 site, this domain has received more attention in structure–function analyses. Mutagenesis and structural approaches of the Saccharomyces cerevisiae ferroxidase coded by Fet3 have established that the residues E185, D283, and D409 are crucial for the catalytic activity of the protein because they create an acidic pocket for the interaction with Fe2+, its oxidation and transfer of electrons to the TNC (Taylor et al., 2005). The Fet3 protein is at the core of the high affinity Fe uptake process in yeast, and it represents the best illustration of the tight link between Cu and Fe homeostasis (Askwith et al., 1994; De Silva et al., 1995; Hassett et al., 1998; Stearman et al., 1996). Located at the cell surface, the role of Fet3 is to generate Fe3+ that is then transported into cells by the permease coded by Ftr1. In order to avoid the release and precipitation of Fe3+ in the medium, Fet3 and Ftr1 form a protein complex, where Fe3+ is directly channeled from Fet3 to Ftr1 and into the cell (Kosman, 2010; Kwok et al., 2006).
In plants, the requirement of ferroxidases for Fe acquisition is not supported by any genetic or biochemical direct evidences. Nevertheless, two genes, LPR1 and LAC12, have recently been identified as ferroxidases, by genetic and transcriptomic approaches, respectively. The LPR1 gene (for Low Phosphate Response1) was first identified by a QTL approach based on the primary root growth in response to phosphate (Pi) deprivation (Reymond et al., 2006; Svistoonoff et al., 2007). One of the typical effects of phosphate deficiency is the growth arrest of the primary root and the induction of lateral roots. This root architecture response is due to both the Pi limitation and the resulting strong increase in Fe availability at the root surface, caused by the lack of Pi that otherwise forms insoluble precipitates with Fe. In this context, the sensing and the first responses to −Pi/+Fe occur in the stem cells of the root tip, resulting in the inhibition of cell division and cell wall thickening. At the molecular level, the −Pi stress post‐transcriptionally activates the transcription factor STOP1, which induces ALMT1 expression and thus malate efflux in the apoplast. The accumulation of malate, an Fe ligand, together with the ferroxidase activity of LPR1 are at the core of an Fe redox cycle that eventually leads to ROS production, local Fe and callose accumulation, and cell wall thickening (Balzergue et al., 2017; Godon et al., 2019; Müller et al., 2015; Ticconi et al., 2009). Although central for the reshaping of root architecture under Pi stress, the ferroxidase activity of LPR1 does not appear to be directly linked with Fe homeostasis.
Very recently, a search for new candidate ferroxidases, based on sequence similarity with Fet3, led to the selection and characterization of LAC12 (Bernal & Krämer, 2021). This member of the laccase family is among the closest homologs to Fet3 (41% similarity), and it also displayed some important structural features such as key amino acids (see above) and one predicted transmembrane domain that could potentially anchor the protein at the cell surface, another important feature of Fet3 for its function in Fe transport. LAC12 was indeed shown to complement the growth defect of the fet3fet4 mutant, impaired in low and high affinity Fe transport systems, strongly suggesting that the protein could indeed mediate Fe2+ oxidation. In planta, the expression of LAC12 was strongly induced in Fe deficiency and knock out mutants were shown to accumulate more Fe in roots and slightly less Fe in leaves in deficiency conditions, pointing to a role of this ferroxidase in the root‐to‐shoot translocation of Fe. By analogy with ceruloplasmin and other related ferroxidases, it was proposed that, in the central cylinder, LAC12 would contribute to the transport of Fe, at the vicinity of a Fe2+ efflux system and citrate/malate transporters, for the formation of Fe3+‐citrate‐malate complexes that are the chemical forms translocated in the xylem sap (Flis et al., 2016; Rellán‐Álvarez et al., 2010).
In the present report, we have focused on a sub‐group within the MCO family in Arabidopsis thaliana (AtMCO1, At4g39830; AtMCO2, At5g21100; AtMCO3, At5g21105) that shared the highest similarity with the yeast Fet3 ferroxidase. The work was particularly focused on MCO1, the closest homolog of Fet3 and on MCO3, the most expressed member of this sub‐group. First, we have shown that MCO1 and MCO3 are potential ferroxidases, on the basis of complementation of the fet3fet4 yeast mutant and in vitro oxygen consumption measurements on whole yeast cells, using Fe2+ as substrate. The expression of the three MCOs is induced by increasing Fe concentrations in the medium and GUS reporter fusions indicated that MCO3 is strictly expressed in shoots whereas MCO1 is mainly expressed in shoots although in high Fe the promoter is also active in roots. Transient expression in tobacco cells have shown that MCO1 and MCO3 are targeted to the apoplast. Although single mutant plants did not display significant growth phenotypes, Fe imaging by Perls/DAB revealed that mesophyll cells of the MCO1 and MCO3 mutant overaccumulated Fe within cells, notably in the plastids. Taken together, our data point to a role of these new MCOs as putative apoplastic ferroxidases in the regulation of Fe transport into cells in high Fe conditions.
2. MATERIALS AND METHODS
2.1. Plant material
The T‐DNA insertion lines SALK_046824, SALK_136041 (Col‐0 background, corresponding to mco1‐1 and mco1‐2, respectively) and SALK_039183 (Col‐0, corresponding to mco3‐1) were obtained from the Nottingham Arabidopsis Stock Center. The mco3‐2 mutants has been generated by CRISPR/Cas9 in Columbia 0 genetic background with the pHEE2F‐tri vector as with the specific gRNA sequences for and MCO3: « d »: 5′‐CGCCCCACAGATACTCCACG‐3′; specific to Exon 4 of MCO3; « c »: 5′‐AACACACAGAATCTAATCGA‐3′; specific to Exon 5 of MCO3 (reverse).
For promoter activity analyses of MCO1 and MCO3, 2.0 kb of genomic sequences located upstream of the MCO1 or MCO3 initiation codon were amplified by PCR from Arabidopsis genomic DNA using primers (promoMCO1F 5′‐cgc ggg tac cCT ATC AAA CGT AGT TTT AG‐3′; promoMCO1R 5′‐ata gcc atg gCA TTT TTC CAA TCG TGT C‐3′; promoMCO3F 5′‐cgc ggg tac cGT GGT ACC GTT TAT GTG GGT TGT TC‐3′; promoMCO3R 5′‐ata gcc atg gCG CCA TGG GGA ATC TTT CAC TTT A‐3′), introducing a KpnI site and a NcoI site, respectively. The amplified promoter fragment was translationally fused to the uidA gene, encoding GUS, by cloning into the KpnI and NcoI sites of the pGUS vector. The promoMCO1‐GUS and promoMCO3‐GUS cassettes were then subcloned as a KpnI‐XbaI fragment into the pBIN19 plant binary vector digested with the same restriction sites.
2.2. Genotyping
Plants homozygous for the mco1‐1, mco1‐2, and mco3‐1 T‐DNA insertions were screened with the T‐DNA left border primer (5′‐TCA ACT TTC GGA ATC AGA TCG‐3′) and the MCO1 and MCO3 specific primers (MCO1‐1‐RP 5′‐GTATGTCAGAGAAAGCCACCG‐3′; MCO1‐2‐RP 5′‐AAGGGTATGGATGCTAAACCG‐3′; MCO3‐RP 5′‐CACGATGAAGCTCTATCCACC‐3′), MCO1 and MCO3 WT allele were identified with specific primers (MCO1‐1‐LP 5′‐TCCACGGTTGAATTGAATCTC‐3′ and MCO1‐1‐RP, MCO1‐2‐LP 5′‐CGGATAAGGGGTATGAACATG‐3′ and MCO1‐2‐RP; MCO3‐LP 5′‐CACGATGAAGCTCTATCCACC‐3′ and MCO3‐RP). The mco3‐2 CRISPR/Cas9 mutant was genotyped (deletion between the fourth and the fifth exons) with the following primers: (amplicon 1100 bp): F‐MCO3 forward: 5′‐ACTGGTGGCATGAGGCTATT‐3′; R‐MCO3 reverse: 5′‐AAACCACACCCATTCCCATA‐3′.
2.3. Plant growth condition
In all experiments, plants are cultivated on half Murashige and Skoog medium, 1.2% (w/v) agar without sucrose and with Fe‐EDTA as iron source, in concentrations indicated in the figures. Medium was buffered with 2.5‐mM MES at pH 5.7. Plants are cultivated in growth chambers with light intensity of 80 PPFD (8 h night to 16 h day), 65% relative humidity at 22°C.
2.4. Yeast strains
Two yeast strains were used, wild type S. cerevisiae (W303: Mata/alpha ade2‐1, ade3, trp1‐1, can1‐100, leu2‐3112, his3‐11, 15, ura3, GAL, psi+) and fet3fet4 diploïd double mutant (Dix et al., 1994) (genotype: Mata/Matalpha ade2/+ can1/can1 his3/his3 leu2/leu2 trp1/trp1 ura3/ura3 fet3‐2::HIS3/fet3‐2::HIS3 fet4‐1::LEU2/fet4‐1::LEU2) that was kindly provided by E Lesuisse (CNRS, France).
2.5. Expression of MCO1 and MCO3 in the fet3fet4 mutant
MCO1 cDNA was amplified by RT‐PCR and cloned in the pDR195 yeast expression vector, at the NotI restriction site, using specific primers (MCO1‐for 5′‐GCGGCCGCATGATGAGAC CGAAGAGATC ATC‐3′; MCO1‐rev 5′‐GCGGCCGCTCAGCGTTTAGTCTGACCACATC‐3′).
MCO3 cDNA was cloned by RT‐PCR with specific primers (bb) and cloned in yeast expression integrative vector pAG306 (Gateway®) under GAP constitutive promoter. Recombinant vectors were linearized by ApaI to perform yeast homologous recombination after transformation to integrate the vector into yeast genome. Positive clones were recovered on ‐URA selection medium (YNB + 2% glucose + 200‐μM FeCl3) and verified by PCR. Three independent clones were selected to perform drop tests experiments.
A chimeric MCO3 cDNA sequence was ordered from TWIST Bioscience group, which delivered the sequence in form of a gateway donor vector (pTWIST‐Entry). Subcloning of MCO3(ch) cDNA sequence was performed by LR recombination with LR clonase II kit from Thermofisher© in pAG306 integrative vector and the fet3fet4 mutant was transformed and positive clones verified by PCR as above. Two independent clones were selected to perform drop test experiments. The MCO3(ch) sequence was modified as follows: predicted signal peptide in N‐ter was removed (E5 to V44) and the transmembrane domain of FET3 (T543 to F636) added in C‐ter.
2.6. Drop tests experiments
Yeast clones were incubated at 30°C in an agitating incubator in 15 ml of YPD + 2% glucose. Cells were then harvested, washed once with sterile water, and the OD of the cultures adjusted to 1 before realizing serial dilutions as indicated; 5 μl drops were deposited on YPD + 2% glucose with or without BPDS (bathophenanthroline disulfonic acid disodium salt) for fet3fet4‐MCO3 and on YNB + 2% glucose + 2 μg/ml uracil and different Fe or Cu concentrations for fet3fet4‐MCO3(ch). The Fe source was FeCl3 and Cu source was CuSO4. Petri dishes were incubated 3 to 6 days and pictures taken with scanner.
2.7. O2 consumption/ferroxidase activity
Real time O2 concentration (μM) and O2 flux (pmol·s−1·ml−1) were determined with Oroboros‐O2k systems from Oroboros instruments©. Each chamber possesses a Clark electrode, an agitating system and controlled temperature. Cultures of each line were prepared as for drop tests. To induce FET3 ferroxidase in WT (positive control), medium for WT contained YPD + 2% glucose + 50 μM of BPDS. fet3fet4 expressing MCO3(ch) was cultivated in the same medium than WT. fet3fet4 was cultivated in YPD + 2%glucose without BPDS. Culture densities were calibrated to DO600nm = 1, washed with distilled H2O and resuspended in Na acetate buffer 0.1‐M pH 5. Cultures were then concentrated 10‐fold in the same buffer right before the measurement (cell concentration ~250.106 cells·ml−1). The Oroboros chambers were filled with 2 ml of cultures, two separated chambers measure O2 concentration and O2 flux, MCO3(ch) cultures were always measured with WT or fet3fet4 in the opposite chamber. After stabilization of O2 in the chamber, 5 μM (final concentration) of antimycine was injected in both chambers to inhibit completely O2 consumption due to mitochondrial respiration. O2 flux measured at this point represented background of O2 consumption. Then 100 μM (final concentration) of freshly prepared FeSO4 was injected in both chambers and after stabilization, O2 flux plateau was measured. Two additional injections were performed after 3–4 min of stabilization. FeSO4 solution was prepared extemporaneously at each measurement. O2 flux after antimycin injection was subtracted from O2 flux after iron injection to obtain Fe‐dependent O2 consumption.
2.8. Localization of MCO1 and MCO3 in tobacco
MCO1 and MCO3 cDNA were subcloned from a pDonor207 Gateway vector to a pUBC‐RFP‐destination vector with LR clonase II kit from Thermofisher. Nicotiana tabacum 6 weeks‐old leaves were transiently transformed with the pUBC‐MCO1:RFP or pUBC‐MCO3:RFP vectors by agro‐infiltration and incubated at room temperature for 48 h. Leaves were co‐infiltrated with agrobacteria containing pUBC‐PM‐Apo vector. PM‐Apo is a construct combining a pHluorin and a transmembrane domain, which has the same excitation/emission spectrum than GFP and was used as a marker of the plasma membrane. Small leaf disks were mounted on slides and signals were observed under confocal microscope with a 40×/water objective.
2.9. RTqPCR
A total of 50–100 mg of seedlings were ground with a ball mill at 30 shakes/s for 1 min in 2 ml tubes (containing two steel beads). Total RNA was extracted by phenol/chloroform method with (Tri‐Reagent® from Molecular Research Center) followed by isopropanol precipitation. RNA pellets were washed with ethanol 75%, dried and resuspended with 30 μl of sterile distilled water. Total RNA extracts were measured with NanoPhotometer® N60/N50 from IMPLEM. RNA quality was checked by electrophoresis on 2% agarose gel and stored at −80°C. cDNA was produced with GoScript™ Reverse Transcription System from Promega. cDNA was diluted 1/50 in distilled sterile water and used as template for qPCR. qPCR was performed with ONEGreen fast qPCR premix from OZYME with corresponding primers. ACT2 forward: 5′‐TCTTGTTCCAGCCCTCGTTT‐3′; ACT2 reverse: 5′‐CTTTGCTCATACGGTCAGCGA‐3′; FER1 forward: 5′‐GTCGTGTTCCAGCCTTTCG‐3′; FER1 reverse: 5′‐TGCCCTCTCTCTTCCTCACT‐3′; MCO1 forward: 5′‐ACGCAAACAACAGTGAAACG‐3′; MCO1 reverse: 5′‐GCAGTGAAACGACCAAACG‐3′; MCO2 forward: 5′‐ACGGCATACGTCAGAAAGGG‐3′; MCO2 reverse:5′‐GTAAGTGAAAGTCTCGCCAGGA‐3′; MCO3 forward 5′‐AACGAAAGGTAGCGGGATTT‐3′; MCO3 Reverse 5′‐GTAACGGCGGATTCTTCAAA‐3′.
2.10. Iron staining by Perls/DAB procedure
Iron staining by Perls method with DAB intensification was performed according to (Roschzttardtz et al., 2009), both on whole seedlings and on histological sections from leaves.
3. RESULTS
3.1. Identification of MCO1, MCO2, and MCO3, three potential ferroxidases
The search for new ferroxidases was initiated by looking for proteins with high sequence similarity with the yeast ferroxidase ScFet3. The closest protein from Arabidopsis, sharing 43% similarity with ScFet3, corresponded to an MCO of unknown function (At4g39830) although annotated as a putative ascorbate oxidase, which we named MCO1 (Figure 1a). The Arabidopsis genome actually contained two other closely related genes that were further named MCO2 (At5g21100) and MCO3 (At5g21105). These three genes formed a subgroup closely related to the family of laccases from Arabidopsis. In a similarity tree built with protein sequences from laccases of 9 plant species, MCO1, MCO2, and MCO3 were forming a specific group containing ascorbate oxidases and three known ferroxidases, ScFet3, AtLPR1 and AtLPR2, suggesting some degree of substrate specificity of these members, compared with the other laccases (Figure 1a). At the gene expression level, these three genes displayed some quantitative differences. In seedlings grown in standard medium (containing 50‐μM Fe), MCO3 displayed the highest expression, whereas, on the opposite, the expression of MCO2 was barely detectable (Figure 1b). On the basis of this first result, we further focused on MCO1, the closest homolog of the yeast ferroxidase Fet3, and MCO3, the most expressed gene of the subgroup.
FIGURE 1.

(a) Neighbor‐joining similarity tree illustrating the relatedness of several multicopper oxidases from plants that are annotated as laccases (LAC), ascorbate oxidases (AO), or low phosphate response (LPR). The 17 laccases (LAC) from Arabidopsis appear in red, the yeast ferroxidase Fet3 (ScFet3) and the three MCOs in bold. The different plant species considered were as follows: Acer pseudoplatanus (Ap), Arabidopsis thaliana (At), Cucurbita pepo (Cp), Cucurbita sativa (Cs), Liriodendron tulipifera (Lt) Nicotiana tabacum (Nt), Oryza sativa (Os), Pinus taeda (Pt), Populus trichocarpa (Ptri), Saccharomyces cerevisiae (Sc). The tree was generated with Seaview 5.0.4, based on Clustal alignment with the method of maximum parsimonia with 100 bootstrap. (b) Relative expression profile of AtMCO1, AtMCO2, and AtMCO3, analyzed by RT‐QPCR and quantified as relative to the expression of the Actin 2 gene, from 12 day‐old seedlings grown on standard Fe condition
3.2. MCO1 and MCO3 complement the yeast Fe uptake mutant fet3fet4
First, we tested whether the heterologous expression of MCO1 and MCO3 could complement the growth defect of the high and low affinity yeast uptake mutant fet3fet4, impaired in both the ferroxidase Fet3 (component of the high affinity uptake system) and the low affinity Fe transporter Fet4 (Dix et al., 1994). While the expression of the full length MCO1 cDNA improved the growth of yeast in Fe deficiency (Figure 2a), the expression of MCO3 did not yield significant and reproductive results (Figure S1). Since the predicted transmembrane domain of MCO3 was significantly shorter than MCO1 (Figure S2), we hypothesized that this feature could affect the proper targeting of MCO3 to the plasma membrane and its interaction with the Ftr1 permease, which is another requisite for a full complementation. We therefore decided to construct and express a chimeric version of MCO3, by replacing the native transmembrane domain with the Fet3 transmembrane domain, which was placed in the C‐terminus of the polypeptide (instead of N‐terminus for the Arabidopsis MCOs), in a configuration comparable with Fet3. The expression of this chimeric form, named MCO3(ch) did complement the growth defect of the fet3fet4 mutant in Fe deficiency (Figure 2a). Moreover, the expression of MCO3 also alleviated, some extent, the sensitivity of the fet3fet4 mutant to high Cu concentration in the medium. The sensitivity to high Cu is another phenotype specific of the fet3 mutation and was attributed to the lack of CuI‐oxidase activity (Stoj et al., 2006). In order to further confirm the ferroxidase activity of MCO3, we measured Fe2+‐dependent O2 consumption on whole cells, with a Clark electrode. Cell suspensions were incubated in closed chambers with antimycin to inhibit mitochondria respiration and the O2 consumption was monitored after the addition of Fe2+ in the reaction medium. Compared with the fet3fet4 mutant cells, the expression of MCO3(ch) restored O2 consumption at levels comparable with WT cells (Figure 2b). Taken together, the results support our initial hypothesis that MCO1 and MCO3 are functional ferroxidases.
FIGURE 2.

The heterologous expression of MCO1 and MCO3(ch) cDNA complements the yeast ferroxidase‐defective fet3fet4 mutant. (a) Wild‐type (positive control), ferroxidase‐defective fet3fet4 strain (negative control) and two clones of fet3fet4 transformed with either the integrative plasmid pAG306 containing the chimeric version of MCO3 (MCO3(ch), fused to the transmembrane domain of Fet3) or with the pDR195 plasmid with MCO1 were plated on Fe‐rich medium (+Fe) supplemented with 200‐μM FeCl3, on Fe‐deficient medium (−Fe) supplemented with 5 μM FeCl3 and on high copper medium (+Cu) containing 800 μM CuSO4. Aliquots (5 μl) of the indicated serial dilutions were plotted on the media. (b) Quantification of O2 consumption, measured on cell suspensions expressing MCO3(ch), after treatment with antimycin. The O2 consumption was monitored after the addition of FeSO4. Values are average ± SD of 3 independent acquisitions. Asterisks represent significative differences compared with negative control fet3fet4 (n = 3 independent cultures. Test is ANOVA followed by post‐hoc Tukey HSD p < 0.05) (±SD).
3.3. MCO1 and MCO3 are upregulated with increasing Fe concentrations
To test whether the expression of the three MCOs was regulated by the Fe status, seedlings were cultivated in Fe‐deficient (no Fe added, +BPDS), standard Fe (50‐μM Fe‐EDTA), and Fe excess (250‐μM Fe‐EDTA) conditions. The ferritin gene FER1 was also included in these tests as a well‐suited marker for the response to Fe excess, because the level of expression of FER1 is positively correlated with the Fe concentration in the medium (Petit, Briat, et al., 2001; Petit, van Wuytswinkel, et al., 2001). Interestingly, the expression of MCO1 and MCO3 responded to the concentration of Fe in the medium in the same way as FER1 (Figure 3). The expression of the three genes was barely detectable in Fe deficiency conditions, induced approximately 10‐fold in standard Fe compared with ‐Fe, and increased twofold between standard Fe and Fe excess (Figure 3). These responses to Fe concentrations strongly suggested that these genes could play a role in Fe homeostasis, particularly in “Fe‐rich” conditions.
FIGURE 3.
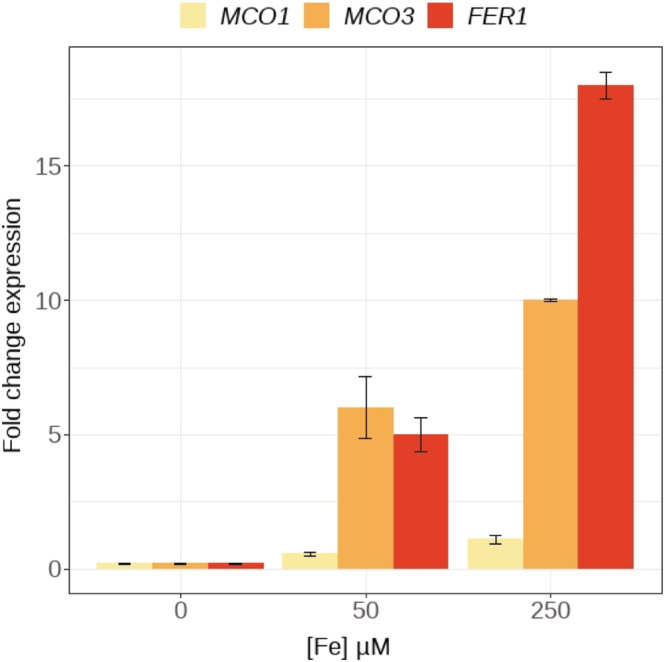
MCO1 and MCO3 transcript levels are positively regulated by Fe concentration. Quantitative real‐time RT‐PCR analysis of MCO1, MCO3, and Ferritin1 (Fer1) expression, from 7‐day‐old plants grown in different Fe concentrations, using the actin 2 gene as a reference. Data are means + SE from one representative experiment from three independent repeats (n = 5 plants per genotype and condition).
We also analyzed the promoter activity of MCO1 and MCO3 on seedlings, in the Fe regimes described above (Figure 4). The promoter activity of both genes did respond to increasing Fe concentrations in the medium. However, the expression of MCO3 was restricted to aerial tissues (hypocotyl, cotyledons, new leaves; Figure 3, lower lane), whereas some expression of MCO1 was detected at the root tip, in standard Fe, and expanded in older root tissues in high Fe (Figure 4, upper lane). In summary, the expression of MCO1 and MCO3 responded to increasing concentrations of Fe in the medium and the tissue pattern of expression pointed to potential functions in leaf cells and, to a lesser degree, in the root tip.
FIGURE 4.

Expression profiles of MCO1 and MCO3. (a) Histochemical staining of the promoter activity of MCO1 and MCO3 fused to the GUS reporter gene. Seedlings were cultivated for 7 days with the indicated Fe concentrations, scale bar = 2 mm (b) Cross‐sections of leaves from seedlings grown with 50‐μM Fe; scale bar = 100 μm.
3.4. MCO1 and MCO3 are targeted to the apoplast
Transient expression in tobacco leaves was used to analyze the subcellular localization of MCO1 and MCO3, fused to the red fluorescent protein (RFP). The RFP tag was chosen over GFP because the MCOs are predicted to follow the secretory pathway, to be targeted to the apoplast, associated to the plasma membrane by the N‐terminal transmembrane domain. As a marker of plasma membrane‐associated proteins, we co‐transformed tobacco leaves with the PM‐Apo construct, which corresponds to a plasma membrane‐anchored fluorescent pH sensor derived from pHluorin (Martiniere et al., 2018). The fluorescent probe of PM‐Apo was shown to be oriented in the apoplastic side, a few nanometers away from the plasma membrane (Martiniere et al., 2018). As already reported, the signal of PM‐Apo was evenly distributed at the cell periphery, whereas MCO1‐RFP and MCO3‐RFP, although at the periphery, appeared to be restricted to specific spots (Figure 5a,d). We then exposed the epidermal cells to mannitol, to induce plasmolysis. In that case, MCO1‐RFP was somehow retained at the vicinity of the plasma membrane (Figure 5b). The fluorescence measurement along a line between two neighboring cells (PM‐apoplast‐PM, orange line in Figure 4b) showed that, actually, the signals of PM‐Apo and MCO1‐RFP did not perfectly overlap, indicating that, although associated to the plasma membrane, MCO1‐RFP was not as closely bound as PM‐Apo (Figure 5c). The signal corresponding to MCO3‐RFP did fill all the apoplastic space left between two adjacent plasma membranes, after the plasmolysis, indicating that, contrary to MCO1‐RFP, MCO3‐RFP was not associated to the plasma membrane (Figure 5e). The fluorescence signals of PM‐Apo and MCO3‐RFP along a line between two adjacent cells further confirmed that the signals of PM‐Apo and MCO3‐RFP did not overlap (Figure 5f). Actually, in that case, it was obvious that MCO3‐RFP was filling the space (approximately 18 μm) between the two plasma membranes, highlighted with the PM‐Apo (Figure 5f). This major difference between MCO1 and MCO3 in the association to the cell membrane could be due, at least in part, to the length of the predicted N‐terminus transmembrane domain, which might not be long enough for MCO3 to be inserted in the membrane and anchor the protein, contrary to MCO1 (Figure S2). These results are thus in line with those observed in yeast complementation.
FIGURE 5.

MCO1 and MCO3 are targeted to the apoplast. Transient expression of MCO1‐RFP (a–c) and MCO3‐RFP (d–f) in tobacco leaves, co‐transformed with the plasma membrane marker Pm‐Apo. (b,e) Pictures were taken after plasmolysis of the leaf disks (0.5‐M mannitol for 15 min), the yellow lines correspond to the Y‐projection of the signal plotted in (c) and (e). Scale bars = 20 μm.
3.5. The MCO1 and MCO3 mutants accumulate more Fe in plastids of mesophyll cells
The four mutant genotypes isolated and used in this work (mco1‐1, mco1‐2, mco3‐1, mco3‐2) did not show any macroscopic phenotypes, in any Fe regime tested (deficiency, standard, or excess), and, moreover, the total Fe content in seedlings was not significantly different from the wild type (data not shown). Nevertheless, because the biochemical and expression data obtained so far were suggesting a role of MCO1 and MCO3 in the redox cycling of Fe in the apoplast of mesophyll cells, we further investigated the subcellular distribution of Fe, in standard and excess Fe, using the Perls/DAB procedure on ultrathin sections of leaves from wild type and mco1‐1, mco1‐2, and mco3‐1 and mco3‐2 knock‐out mutants (see Figure S3 for the description of the mutant alleles and Figure S4 for the loss of full‐length cDNA expression in the mutants). In standard Fe condition, Fe was barely detectable in wild type leaves (Figure 5a). In this growth condition, the mco1‐1, mco1‐2, mco3‐1, and mco3‐2 mutants displayed a higher accumulation of Fe‐rich dots in plastids from mesophyll cells (Figure 6a; see inserts in the corresponding picture). The exposure to Fe excess did provoke the accumulation of Fe in plastids, in wild‐type mesophyll cells (Figure 6b). However, the accumulation of Fe‐rich structures in chloroplasts was much more intense in all four mutant genotypes grown on Fe excess, indicating that, at the cellular level, the mutations of MCO1 and MCO3 did affect the amount of Fe translocated inside cells, which ended up being stored in the chloroplasts. Taken together, the Fe imaging analyses strongly suggested that MCO1 and MCO3 are involved in the control of Fe transport inside mesophyll cells, most likely through their ferroxidase activity in the apoplast (Figure 6).
FIGURE 6.

The mco1 and mco3 mutants accumulate more Fe inside mesophyll cells. (a) Histochemical staining of Fe with Perls/DAB on leaf sections from wild‐type, and mco1‐1, mco1‐2, mco3‐1, and mco3‐2 mutant seedlings grown on standard (50 μM) Fe for 10 days. Arrowheads in indicate Fe‐rich structures as described in (Roschzttardtz et al., 2013). Scale bars = 50 μm. (b) Histochemical staining of Fe with Perls/DAB on leaf sections from wild‐type, and mco1‐1, mco1‐2, mco3‐1, and mco3‐2 mutant seedlings grown on high Fe (250 μM) Fe for 10 days. Arrowheads in indicate Fe‐rich structures as described in (Roschzttardtz et al., 2013). Scale bars = 50 μm.
4. DISCUSSION
Although the regulation of the equilibrium between Fe2+ and Fe3+ iron forms has long been identified as a central process for iron homeostasis in living organisms, in plants, the ferroxidation side of this redox cycling has received much less attention than Fe3+reduction. Only recently, several approaches have led to the identification of genes from the MCO family with a proposed role as ferroxidases. The LPR1 gene was initially identified by QTL approach on the growth response of the primary root to phosphate deprivation (Reymond et al., 2006; Svistoonoff et al., 2007), and it was later shown that, through its ferroxidation activity, LPR1 contributed to ROS production and callose deposition in the root apoplast, which was central for phosphate sensing (Muller et al., 2015). More recently, the analysis of cross‐talks between Fe and Cu homeostasis pointed to the requirement of Cu for the root‐to‐shoot transport of Fe and, more precisely, to the role of copper proteins of the MCO family, in particular LAC12, in long distance Fe transport (Bernal et al., 2012; Bernal & Krämer, 2021). Here, we have shown that two of the closest homologs of the yeast ferroxidase Fet3, MCO1 and MCO3, code for proteins with a ferroxidase activity when expressed in the yeast fet3 mutant. We further showed that MCO1 and MCO3 were targeted to the apoplast, that the corresponding genes were mostly, but not exclusively, expressed in shoots and, more interestingly, that their expression was induced by increasing Fe concentration in the medium, suggesting a function in iron‐rich situations. Indeed, in high Fe, the different mutant genotypes displayed high Fe accumulation in plastids of mesophyll cells, strongly suggesting that MCO1 and MCO3 do play a role in the control of Fe entry in mesophyll cells in Fe‐rich conditions.
Based on growth complementation and in vitro measurements of Fe2+‐dependent O2 consumption, we have shown that MCO3 can catalyze the oxidation of Fe2+. In general, laccases and related proteins of the MCO family have been considered as rather promiscuous, regarding the one‐electron donor substrate (Hoegger et al., 2006; Messerschmidtt & Huber, 1990). Since the substrate specificity is driven by the environment of the T1 Cu site, we have compared the predicted 3D structures of MCO3 and Fet3 around T1 (Figure S5A‐B). Three amino acids (E185, D283, D409) have been proposed to be crucial for the recognition and binding of Fe2+ in Fet3 (Taylor et al., 2005). By comparison, the corresponding “acidic pocket” of MCO3 only contained two acidic amino acids (E200 and D479). Consequently, the calculated electrostatic charges at the surface of the pocket formed around T1 appeared to be more negatively charged for Fet3 than MCO3 (Figure S5C), suggesting that the attractivity for Fe2+ and thus the affinity of the enzyme could be much higher for the yeast ferroxidase than MCO3. This structural difference at the T1 site could be linked to the fact that on the one hand Fet3 is expressed in Fe deficiency (high affinity required) whereas MCO1 and MCO3 are induced in high Fe concentrations, where a high affinity for Fe should not be a strong requirement.
The MCOs with ferroxidase activity characterized so far (LPR1, LAC12, MCO1, and MCO3) were shown to respond differently to the Fe status. The expression of LPR1 was not regulated by Fe (Svistoonoff et al., 2007), whereas LAC12 was induced by Fe deficiency in roots (Bernal & Krämer, 2021) and MCO1 and MCO3 were induced in conditions of Fe excess, suggesting that the different ferroxidases may be involved in very distinct processes that, nevertheless, share the need for a switch from Fe2+ to Fe3+. For instance, the Fe loading in the root xylem was proposed to associate a Fe2+ efflux transporter (i.e., a ferroportin) with the ferroxidase LAC12 and the citrate effluxer FRD3, in order to generate the Fe3+‐citrate complexes that are translocated to leaves (Bernal & Krämer, 2021). Here, we propose that ferroxidases might be required to cope with excess Fe (Fe2+) in the apoplast of leaves. By displacing the equilibrium toward Fe3+, the MCOs would limit the accumulation of the transport‐competent and highly reactive Fe2+ ions and therefore limit their toxicity (Figure 7). Although the exact balance between Fe2+ and Fe3+ in the apoplast has never been probed and reported, some elements suggest that the redox conditions of the apoplast would displace the balance toward Fe2+. First, the concentration of ascorbate in the apoplast was estimated to range between 1 and 4 mM (Zechmann, 2018; Zechmann et al., 2011), which is potentially several orders of magnitude higher than the concentration of Fe and therefore rather favorable for the stabilization of Fe2+. Second, the exposure to light is prone to generate Fe2+ by photoreduction. Indeed, photons have been shown to catalyze the reduction of Fe, both in vitro and in vivo in leaves (Bienfait & Scheffers, 1992; Gracheva et al., 2022). On the basis of these elements, it could be expected that mesophyll cells would require an efficient system to maintain a strict balance between Fe2+ and Fe3+, through the action of apoplastic ferroxidases, to counteract the reducing effects of ascorbate and photons. Additionally, Fe2+ might not be the only (or even the preferred) substrate for MCO1 and MCO3. Actually, because the two MCOs also share the highest identity with some ascorbate oxidases, it cannot be excluded that these enzymes could also oxidize ascorbate into monodehydroascorbate. If this hypothesis were true, the function of MCO1 and MCO3 would be to control the ascorbate concentration and therefore the overall redox status of the apoplast. Whether the MCOs are bona fide ferroxidases and/or ascorbate oxidases, the consequences regarding Fe would be similar because in both cases their activity would displace the equilibrium toward the accumulation of Fe3+ (Figure 7). Interestingly, caeruloplasmin and more recently MCO3 from Drosophila were shown to carry both ferroxidase and ascorbate oxidase activities (Blake et al., 1983; Wang et al., 2018).
FIGURE 7.

Proposed model for MCO1 and MCO3 function in mesophyll cells. (1) Iron is delivered to mesophyll cells from xylem and phloem vascular systems, as Fe3+‐citrate‐malate and Fe2+‐nicotianamine complexes, respectively. (2) Given the redox environment of the apoplast (millimolar concentrations of ascorbate), a significant proportion of Fe would be reduced to Fe2+ that is much more mobile, redox active and transportable than Fe3+. (3) Once in cells, Fe atoms are either incorporated in the prosthetic groups of Fe‐proteins or stored as Fe‐ferritin complexes in the plastids or as Fe‐phytate complexes in the vacuoles. (4) The function of MCO1 and MCO3 would be to limit the generation of Fe2+ in the apoplast, through their ferroxidation activity. Abbreviations: NA‐Fe2+, nicotianamine‐iron complex, Cit/Mal‐Fe3+, citrate‐malate‐iron complexes, AsA, ascorbate, MDHA, monodehydroascorbate, VTLs, VIT1‐like iron transporters
In summary, this work has led to the identification of two new potential ferroxidases in Arabidopsis. Compared with yeast or animal cells where ferroxidases are central players in Fe high‐affinity uptake systems, plants apparently possess a multiplicity of ferroxidases that play different roles, in different organs and in response to different nutritional constrains, directly or indirectly related to Fe. In all cases, the role of these ferroxidases is to oxidize Fe into Fe3+ outside of cells, such as in the apoplast of the root tip for LPR1, around the root xylem for LAC12 and in the apoplast of mesophyll cells for MCO1 and MCO3, for different physiological activities such as the induction of cell wall thickening and growth arrest, the promotion of root‐to‐shoot translocation of Fe as ferric complexes and the regulation of its transport into mesophyll cells in Fe‐rich conditions, respectively.
CONFLICT OF INTEREST
The authors declare that the research was conducted without any commercial of financial relationships that could constitute a potential conflict of interest.
AUTHOR CONTRIBUTIONS
AB, MS, LW, SC, CC, and SM designed and performed the experiments, collected, and analyzed the data. AB and SM prepared the figures, and SM wrote the manuscript. The authors thank Carine Alcon and the PHIV platform for technical help in fluorescence microscopy.
Supporting information
Figure S1: The heterologous expression of MCO3 native cDNA does not complement. The yeast ferroxidase‐defective fet3fet4 mutant. Wild‐type (WT), ferroxidase‐defective fet3fet4 strain (negative control) and three clones of fet3fet4 transformed with the integrative plasmid pAG306 containing the native version of MCO3 were plated on Fe‐rich medium (+Fe) supplemented with 200 μM FeCl3, or on Fe‐deficient medium (‐Fe) supplemented with 5 μM FeCl3. Aliquots (5 μl) of the indicated serial dilutions were plotted on the media and grown for 7 days.
Figure S2: Predicted structure of the N‐terminal transmembrane domain of MCO1 and MCO3, obtained with the PyMOL software.
Figure S3: Schematic structure of the exons‐introns of MCO1 and MCO3 and the positions of T‐DNA insertions and CRISPR/Cas9‐induced deletion of the different mutant lines isolated and used in this work.
Figure S4: Semi quantitative RT‐PCR of full‐length AtMCO1 and AtMCO3 cDNAs in wild‐type and the different mco1 and mco3 mutants. The actin2 cDNA (ACT2) was used as a RT‐PCR loading control.
Figure S5: 3D structure of Fet3 and MCO3, view of the iron binding site (T1). (A) Zoom on the iron binding site of FET3 (left), the orange sphere represents the copper atom of the center T1 bound by two residues H413 and H489. Residues E185, D283 and D409 are essential for iron binding according to Taylor et al., 2005. The same area in MCO3 (middle) with a residue E200 and D479 closest to the putative iron binding site of FET3. The superposition of the two sites from FET3 and MCO3 (right). (B) 3D structures generated with PyMOL software. FET3 structure (green) with the four copper atoms, the structure of MCO3 (purple) both oriented to present the copper of the T1 center (oxidizing iron) in the foreground. (C) Qualitative representation of the distribution of surface electrostatic charges of FET3 (left) and MCO3 (right). Red: negative charge, Blue: positive charge. The black arrow indicates the position of the copper T1 center.
ACKNOWLEDGMENTS
The authors wish to thank the French Ministry of Research and Innovation for the funding of AB PhD fellowship and the French National Research Agency for the funding of the project (ANR SVSE2‐087217; ANR‐16‐CE20‐0019).
Brun, A. , Smokvarska, M. , Wei, L. , Chay, S. , Curie, C. , & Mari, S. (2022). MCO1 and MCO3, two putative ascorbate oxidases with ferroxidase activity, new candidates for the regulation of apoplastic iron excess in Arabidopsis. Plant Direct, 6(11), e463. 10.1002/pld3.463
DATA AVAILABILITY STATEMENT
The data that support the findings of this study are available from the corresponding author upon reasonable request.
REFERENCES
- Askwith, C. , Eide, D. , Van, H. A. , Bernard, P. S. , Li, L. , Davis, K. S. , Sipe, D. M. , & Kaplan, J. (1994). The FET3 gene of S. cerevisiae encodes a multicopper oxidase required for ferrous iron uptake. Cell, 76, 403–410. 10.1016/0092-8674(94)90346-8 [DOI] [PubMed] [Google Scholar]
- Balzergue, C. , Dartevelle, T. , Godon, C. , Laugier, E. , Meisrimler, C. , Teulon, J. M. , Creff, A. , Bissler, M. , Brouchoud, C. , Hagege, A. , Muller, J. , Chiarenza, S. , Javot, H. , Becuwe‐Linka, N. , David, P. , Peret, B. , Delannoy, E. , Thibaud, M. C. , Armengaud, J. , … Desnos, T. (2017). Low phosphate activates STOP1‐ALMT1 to rapidly inhibit root cell elongation. Nature Communications, 8, 1–16. 10.1038/ncomms15300 [DOI] [PMC free article] [PubMed] [Google Scholar]
- Bernal, M. , Casero, D. , Singh, V. , Wilson, G. T. , Grande, A. , Yang, H. J. , Dodani, S. C. , Pellegrini, M. , Huijser, P. , Connolly, E. L. , Merchant, S. S. , & Kramer, U. (2012). Transcriptome sequencing identifies SPL7‐regulated copper acquisition genes FRO4/FRO5 and the copper dependence of iron homeostasis in Arabidopsis. Plant Cell, 24, 738–761. 10.1105/tpc.111.090431 [DOI] [PMC free article] [PubMed] [Google Scholar]
- Bernal, M. , & Krämer, U. (2021). Involvement of Arabidopsis multi‐copper oxidase‐encoding LACCASE12 in root‐to‐shoot iron partitioning: A novel example of copper‐iron crosstalk. Frontiers in Plant Science, 12, 688318. 10.3389/fpls.2021.688318 [DOI] [PMC free article] [PubMed] [Google Scholar]
- Bienfait, H. F. , & Scheffers, M. R. (1992). Some properties of ferric citrate relevant to the iron nutrition of plants. Plant and Soil, 143, 141–144. 10.1007/BF00009139 [DOI] [Google Scholar]
- Blake, D. R. , Blann, A. , Bacon, P. A. , Farr, M. , Gutteridge, J. M. C. , & Halliwell, B. (1983). Ferroxidase and ascorbate oxidase activities of ceruloplasmin in synovial‐fluid from rheumatoid patients. Clinical Science, 64, 551–553. 10.1042/cs0640551 [DOI] [PubMed] [Google Scholar]
- De Silva, D. M. , Askwith, C. C. , Eide, D. , & Kaplan, J. (1995). The FET3 gene product required for high affinity iron transport in yeast is a cell surface ferroxidase. The Journal of Biological Chemistry, 270, 1098–1101. 10.1074/jbc.270.3.1098 [DOI] [PubMed] [Google Scholar]
- Dix, D. R. , Bridgham, J. T. , Broderius, M. A. , Byersdorfer, C. A. , & Eide, D. J. (1994). The FET4 gene encodes the low affinity Fe(II) transport protein of Saccharomyces cerevisiae . The Journal of Biological Chemistry, 269, 26092–26099. 10.1016/S0021-9258(18)47163-3 [DOI] [PubMed] [Google Scholar]
- Flis, P. , Ouerdane, L. , Grillet, L. , Curie, C. , Mari, S. , & Lobinski, R. (2016). Inventory of metal complexes circulating in plant fluids: A reliable method based on HPLC coupled with dual elemental and high‐resolution molecular mass spectrometry detection. New Phytologist, 211, 1129–1141. 10.1111/nph.13964 [DOI] [PubMed] [Google Scholar]
- Godon, C. , Mercier, C. , Wang, X. Y. , David, P. , Richaud, P. , Nussaume, L. , Liu, D. , & Desnos, T. (2019). Under phosphate starvation conditions, Fe and Al trigger accumulation of the transcription factor STOP1 in the nucleus of Arabidopsis root cells. Plant Journal, 99, 937–949. 10.1111/tpj.14374 [DOI] [PMC free article] [PubMed] [Google Scholar]
- Gracheva, M. , Homonnay, Z. , Singh, A. , Fodor, F. , Marosi, V. B. , Solti, A. , & Kovacs, K. (2022). New aspects of the photodegradation of iron (III) citrate: Spectroscopic studies and plant‐related factors. Photochemical & Photobiological Sciences, 21, 983–996. 10.1007/s43630-022-00188-1 [DOI] [PubMed] [Google Scholar]
- Grillet, L. , Ouerdane, L. , Flis, P. , Hoang, M. T. , Isaure, M. P. , Lobinski, R. , Curie, C. , & Mari, S. (2014). Ascorbate efflux as a new strategy for iron reduction and transport in plants. The Journal of Biological Chemistry, 289, 2515–2525. 10.1074/jbc.M113.514828 [DOI] [PMC free article] [PubMed] [Google Scholar]
- Hassett, R. F. , Romeo, A. M. , & Kosman, D. J. (1998). Regulation of high affinity iron uptake in the yeast Saccharomyces cerevisiae. Role of dioxygen and Fe. The Journal of Biological Chemistry, 273, 7628–7636. 10.1074/jbc.273.13.7628 [DOI] [PubMed] [Google Scholar]
- Hoang, M. T. T. , Almeida, D. , Chay, S. , Alcon, C. , Corratge‐Faillie, C. , Curie, C. , & Mari, S. (2021). AtDTX25, a member of the multidrug and toxic compound extrusion family, is a vacuolar ascorbate transporter that controls intracellular iron cycling in Arabidopsis. New Phytologist, 231, 1956–1967. 10.1111/nph.17526 [DOI] [PubMed] [Google Scholar]
- Hoegger, P. J. , Kilaru, S. , James, T. Y. , Thacker, J. R. , & Kües, U. (2006). Phylogenetic comparison and classification of laccase and related multicopper oxidase protein sequences. FEBS Journal, 273, 2308–2326. 10.1111/j.1742-4658.2006.05247.x [DOI] [PubMed] [Google Scholar]
- Jeong, J. , Cohu, C. , Kerkeb, L. , Pilon, M. , Connolly, E. L. , & Guerinot, M. L. (2008). Chloroplast Fe(III) chelate reductase activity is essential for seedling viability under iron limiting conditions. Proceedings of the National Academy of Sciences of the United States of America, 105, 10619–10624. 10.1073/pnas.0708367105 [DOI] [PMC free article] [PubMed] [Google Scholar]
- Jeong, J. , & Connolly, E. L. (2009). Iron uptake mechanisms in plants: Functions of the FRO family of ferric reductases. Plant Science, 176, 709–714. 10.1016/j.plantsci.2009.02.011 [DOI] [Google Scholar]
- Kosman, D. J. (2010). Redox cycling in iron uptake, efflux, and trafficking. The Journal of Biological Chemistry, 285, 26729–26735. 10.1074/jbc.R110.113217 [DOI] [PMC free article] [PubMed] [Google Scholar]
- Kwok, E. Y. , Severance, S. , & Kosman, D. J. (2006). Evidence for iron channeling in the Fet3p‐Ftr1p high‐affinity iron uptake complex in the yeast plasma membrane. Biochemistry, 45, 6317–6327. 10.1021/bi052173c [DOI] [PubMed] [Google Scholar]
- Martin‐Barranco, A. , Thomine, S. , Vert, G. , & Zelazny, E. (2021). A quick journey into the diversity of iron uptake strategies in photosynthetic organisms. Plant Signaling & Behavior, 16, 1975088. 10.1080/15592324.2021.1975088 [DOI] [PMC free article] [PubMed] [Google Scholar]
- Martiniere, A. , Gibrat, R. , Sentenac, H. , Dumont, X. , Gaillard, I. , & Paris, N. (2018). Uncovering pH at both sides of the root plasma membrane interface using noninvasive imaging. Proceedings of the National Academy of Sciences of the United States of America, 115, 6488–6493. 10.1073/pnas.1721769115 [DOI] [PMC free article] [PubMed] [Google Scholar]
- Messerschmidtt, A. , & Huber, R. (1990). The blue oxidases, ascorbate oxidase, laccase and ceruloplasmin modelling and structural relationships. European Journal of Biochemistry, 187, 341–352. 10.1111/j.1432-1033.1990.tb15311.x [DOI] [PubMed] [Google Scholar]
- Muller, J. , Toev, T. , Heisters, M. , Teller, J. , Moore, K. L. , Hause, G. , Dinesh, D. C. , Burstenbinder, K. , & Abel, S. (2015). Iron‐dependent callose deposition adjusts root meristem maintenance to phosphate availability. Developmental Cell, 33, 216–230. 10.1016/j.devcel.2015.02.007 [DOI] [PubMed] [Google Scholar]
- Müller, J. , Toev, T. , Heisters, M. , Teller, J. , Moore, K. L. , Hause, G. , Dinesh, D. C. , Bürstenbinder, K. , & Abel, S. (2015). Iron‐dependent callose deposition adjusts root meristem maintenance to phosphate availability. Developmental Cell, 33, 216–230. 10.1016/j.devcel.2015.02.007 [DOI] [PubMed] [Google Scholar]
- Petit, J. M. , Briat, J. F. , & Lobréaux, S. (2001). Structure and differential expression of the four members of the Arabidopsis thaliana ferritin gene family. The Biochemical Journal, 359, 575–582. 10.1042/bj3590575 [DOI] [PMC free article] [PubMed] [Google Scholar]
- Petit, J. M. , van Wuytswinkel, O. , Briat, J. F. , & Lobreaux, S. (2001). Characterization of an iron‐dependent regulatory sequence involved in the transcriptional control of AtFer1 and ZmFer1 plant ferritin genes by iron. The Journal of Biological Chemistry, 276, 5584–5590. 10.1074/jbc.M005903200 [DOI] [PubMed] [Google Scholar]
- Quintanar, L. , Stoj, C. , Taylor, A. B. , Hart, P. J. , Kosman, D. J. , & Solomon, E. I. (2007). Shall we dance? How a multicopper oxidase chooses its electron transfer partner. Accounts of Chemical Research, 40, 445–452. 10.1021/ar600051a [DOI] [PubMed] [Google Scholar]
- Rellán‐Álvarez, R. , Giner‐Martínez‐Sierra, J. , Orduna, J. , Orera, I. , Rodríguez‐Castrilln, J. Á. , García‐Alonso, J. I. , Abadía, J. , & Álvarez‐Fernández, A. (2010). Identification of a tri‐iron(III), tri‐citrate complex in the xylem sap of iron‐deficient tomato resupplied with iron: New insights into plant iron long‐distance transport. Plant and Cell Physiology, 51, 91–102. 10.1093/pcp/pcp170 [DOI] [PubMed] [Google Scholar]
- Reymond, M. , Svistoonoff, S. , Loudet, O. , Nussaume, L. , & Desnos, T. (2006). Identification of QTL controlling root growth response to phosphate starvation in Arabidopsis thaliana . Plant, Cell and Environment, 29, 115–125. 10.1111/j.1365-3040.2005.01405.x [DOI] [PubMed] [Google Scholar]
- Robinson, N. J. , Procter, C. M. , Connolly, E. L. , & Guerinot, M. L. (1999). A ferric‐chelate reductase for iron uptake from soils. Nature, 397, 694–697. 10.1038/17800 [DOI] [PubMed] [Google Scholar]
- Roschzttardtz, H. , Conejero, G. , Curie, C. , & Mari, S. (2009). Identification of the endodermal vacuole as the iron storage compartment in the arabidopsis embryo. Plant Physiology, 151, 1329–1338. 10.1104/pp.109.144444 [DOI] [PMC free article] [PubMed] [Google Scholar]
- Roschzttardtz, H. , Conejero, G. , Divol, F. , Alcon, C. , Verdeil, J.‐L. , Curie, C. , & Mari, S. (2013). New insights into Fe localization in plant tissues. Frontiers in Plant Science, 4, 11. 10.3389/fpls.2013.00350 [DOI] [PMC free article] [PubMed] [Google Scholar]
- Stearman, R. , Yuan, D. S. , Yamaguchi‐Iwai, Y. , Klausner, R. D. , & Dancis, A. (1996). A permease‐oxidase complex involved in high‐affinity iron uptake in yeast [see comments]. Science, 271, 1552–1557. 10.1126/science.271.5255.1552 [DOI] [PubMed] [Google Scholar]
- Stoj, C. S. , Augustine, A. J. , Zeigler, L. , Solomon, E. I. , & Kosman, D. J. (2006). Structural basis of the ferrous iron specificity of the yeast ferroxidase, Fet3p. Biochemistry, 45, 12741–12749. 10.1021/bi061543+ [DOI] [PubMed] [Google Scholar]
- Svistoonoff, S. , Creff, A. , Reymond, M. , Sigoillot‐Claude, C. , Ricaud, L. , Blanchet, A. , Nussaume, L. , & Desnos, T. (2007). Root tip contact with low‐phosphate media reprograms plant root architecture. Nature Genetics, 39, 792–796. 10.1038/ng2041 [DOI] [PubMed] [Google Scholar]
- Taylor, A. B. , Stoj, C. S. , Ziegler, L. , Kosman, D. J. , & Hart, P. J. (2005). The copper‐iron connection in biology: Structure of the metallo‐oxidase Fet3p. Proceedings of the National Academy of Sciences, 102, 15459–15464. 10.1073/pnas.0506227102 [DOI] [PMC free article] [PubMed] [Google Scholar]
- Ticconi, C. A. , Lucero, R. D. , Sakhonwasee, S. , Adamson, A. W. , Creff, A. , Nussaume, L. , Desnos, T. , & Abel, S. (2009). ER‐resident proteins PDR2 and LPR1 mediate the developmental response of root meristems to phosphate availability. Proceedings of the National Academy of Sciences of the United States of America, 106, 14174–14179. 10.1073/pnas.0901778106 [DOI] [PMC free article] [PubMed] [Google Scholar]
- Wang, X. D. , Yin, S. , Yang, Z. H. , & Zhou, B. (2018). Drosophila multicopper oxidase 3 is a potential ferroxidase involved in iron homeostasis. Biochimica et Biophysica Acta‐General Subjects, 1862, 1826–1834. 10.1016/j.bbagen.2018.04.017 [DOI] [PubMed] [Google Scholar]
- Yi, Y. , & Guerinot, M. L. (1996). Genetic evidence that induction of root Fe(III) chelate reductase activity is necessary for iron uptake under iron deficiency. The Plant Journal, 10, 835–844. 10.1046/j.1365-313X.1996.10050835.x [DOI] [PubMed] [Google Scholar]
- Zechmann, B. (2018). Compartment‐specific importance of ascorbate during environmental stress in plants. Antioxidants & Redox Signaling, 29, 1488–1501. 10.1089/ars.2017.7232 [DOI] [PubMed] [Google Scholar]
- Zechmann, B. , Stumpe, M. , & Mauch, F. (2011). Immunocytochemical determination of the subcellular distribution of ascorbate in plants. Planta, 233, 1–12. 10.1007/s00425-010-1275-x [DOI] [PMC free article] [PubMed] [Google Scholar]
Associated Data
This section collects any data citations, data availability statements, or supplementary materials included in this article.
Supplementary Materials
Figure S1: The heterologous expression of MCO3 native cDNA does not complement. The yeast ferroxidase‐defective fet3fet4 mutant. Wild‐type (WT), ferroxidase‐defective fet3fet4 strain (negative control) and three clones of fet3fet4 transformed with the integrative plasmid pAG306 containing the native version of MCO3 were plated on Fe‐rich medium (+Fe) supplemented with 200 μM FeCl3, or on Fe‐deficient medium (‐Fe) supplemented with 5 μM FeCl3. Aliquots (5 μl) of the indicated serial dilutions were plotted on the media and grown for 7 days.
Figure S2: Predicted structure of the N‐terminal transmembrane domain of MCO1 and MCO3, obtained with the PyMOL software.
Figure S3: Schematic structure of the exons‐introns of MCO1 and MCO3 and the positions of T‐DNA insertions and CRISPR/Cas9‐induced deletion of the different mutant lines isolated and used in this work.
Figure S4: Semi quantitative RT‐PCR of full‐length AtMCO1 and AtMCO3 cDNAs in wild‐type and the different mco1 and mco3 mutants. The actin2 cDNA (ACT2) was used as a RT‐PCR loading control.
Figure S5: 3D structure of Fet3 and MCO3, view of the iron binding site (T1). (A) Zoom on the iron binding site of FET3 (left), the orange sphere represents the copper atom of the center T1 bound by two residues H413 and H489. Residues E185, D283 and D409 are essential for iron binding according to Taylor et al., 2005. The same area in MCO3 (middle) with a residue E200 and D479 closest to the putative iron binding site of FET3. The superposition of the two sites from FET3 and MCO3 (right). (B) 3D structures generated with PyMOL software. FET3 structure (green) with the four copper atoms, the structure of MCO3 (purple) both oriented to present the copper of the T1 center (oxidizing iron) in the foreground. (C) Qualitative representation of the distribution of surface electrostatic charges of FET3 (left) and MCO3 (right). Red: negative charge, Blue: positive charge. The black arrow indicates the position of the copper T1 center.
Data Availability Statement
The data that support the findings of this study are available from the corresponding author upon reasonable request.