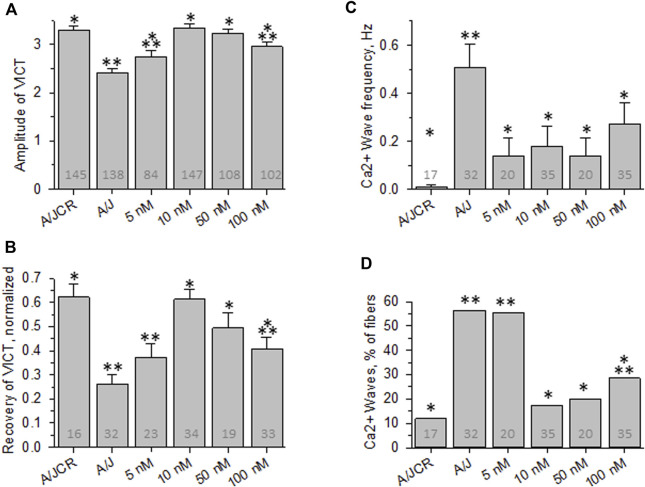
FIGURE 2.
Effect of osmotic shock injury on Ca2+ transients in FDB fibers preloaded with different concentrations of BAPTA-AM. Data from experiments like those shown in Figure 1 were analyzed. (A), averaged amplitudes of Ca2+ transients before OSI presented as (Fmax-F0)/F0. (B), averaged data for recovery of Ca2+ transients at 5 min after OSI. (C), averaged data for frequency of Ca2+ waves at 5 min after OSI. (D), % fibers that produced Ca2+ waves at 5 min after OSI. N is indicated in each bar. *. p < 0.05 compared to A/J (sham). **, p < 0.05 compared to A/JCr control. Student’s t test was used for A-C; Χ 2 was used for (D). VICT = Voltage-induced Ca2+ transient.

