Figure 3.

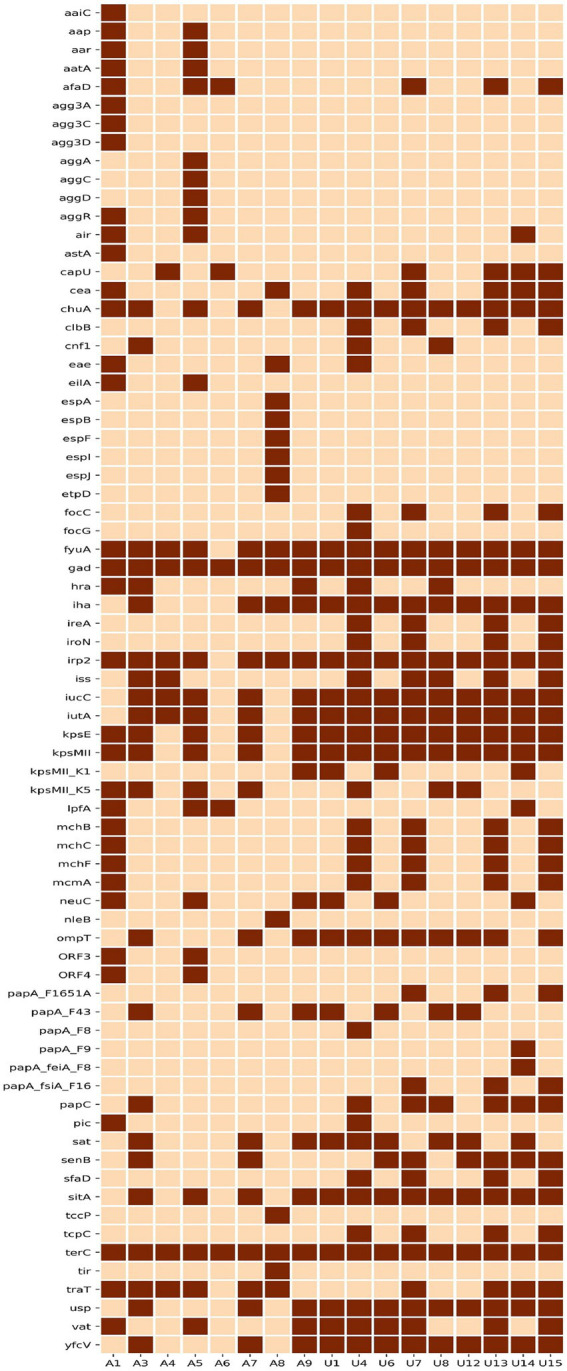
Heat map depicting the distribution of 73 virulence genes amongst 17 NLF E. coli genomes. Dark brown represents the presence, and light brown blocks represent a virulence gene’s absence.

Heat map depicting the distribution of 73 virulence genes amongst 17 NLF E. coli genomes. Dark brown represents the presence, and light brown blocks represent a virulence gene’s absence.