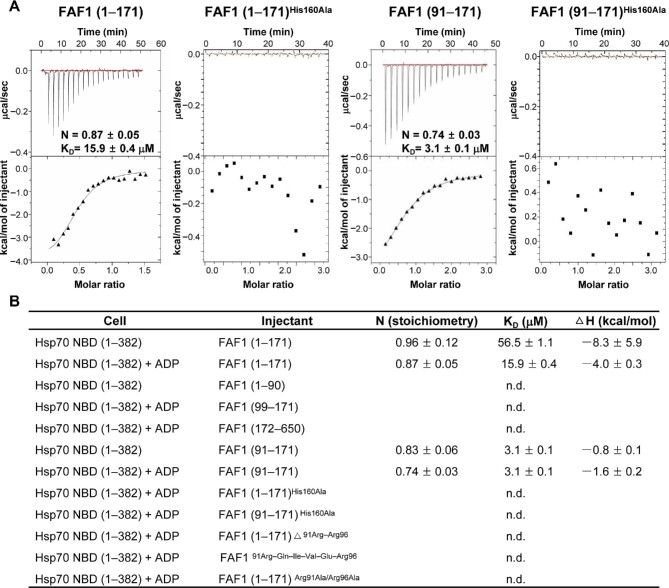
Figure 2.
ITC analysis of FAF1 and Hsp70 NBD. (A) ITC results of FAF1 binding to Hsp70 NBD. FAF1 (aa 1–171), FAF1 (aa 91–171) [His160Ala], FAF1 (aa 91–171), and FA1 (aa 91–171) [His160Ala] were titrated to Hsp70 (aa 1–362) with ADP. The top panel shows the thermal effects associated with the injection, while the bottom panel shows the binding isotherm corresponding to the data in the top panel and the best-fitted curve with a one-site binding model. (B) Summary of ITC measurement.

