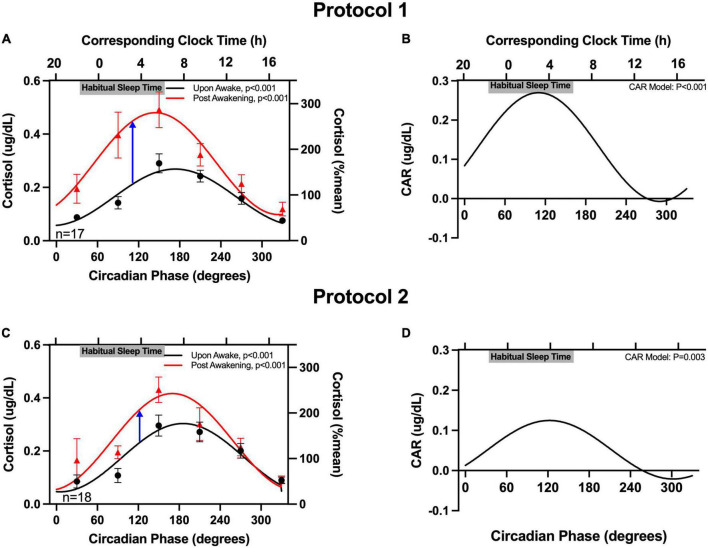
FIGURE 2.
Circadian rhythm in the cortisol awakening response (CAR). The cortisol concentrations upon-awakening and 50 min post-awakening as a function of circadian time are plotted on the left column (A,C) and the CAR is plotted on the right (B,D). Data are expressed as absolute values (left y-axes) and as a percentage of the mean of each participant’s upon-awake values (right y-axes). Participants’ binned data (60°, 4-hour intervals, means±SEM, left y-axes) are depicted as black circles (upon-awake) and red triangles (50 min post-awakening). Binned data were averaged within an individual first, as an individual could contribute more than one point to each bin. The solid lines represent the cosinor model fits. The blue arrows in (A,C) highlight the peaks of CAR in the two protocols. The corresponding clock times (determined from the average times of the DLMO for these participants) are shown on the top x-axes. Gray bars also on the top x-axes indicate the participants’ average habitual sleep times (determined from the at home assessment).

