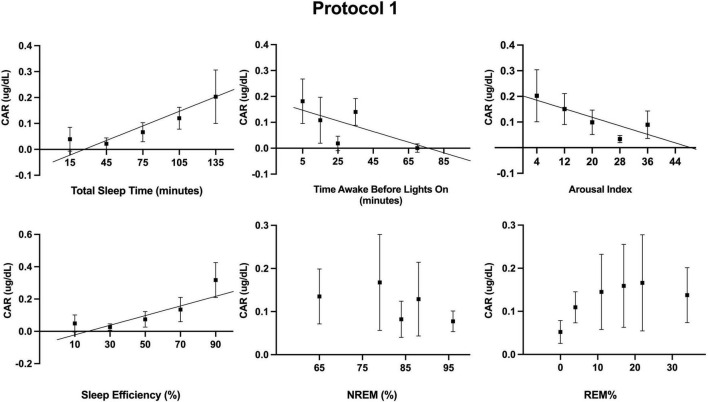
FIGURE 3.
Associations between measured sleep parameters during the 10 forced desynchrony sleep opportunities of protocol 1 and the cortisol awakening response (CAR). Participants’ binned data (binned into 5–6 intervals for a given sleep parameter, means±SEM) are depicted as black squares. Binned data were averaged within an individual first, as an individual could contribute more than one point to each bin. The solid lines represent significant linear regressions as tested using mixed models (see Table 2). A quadratic term was also estimated but not significant.

