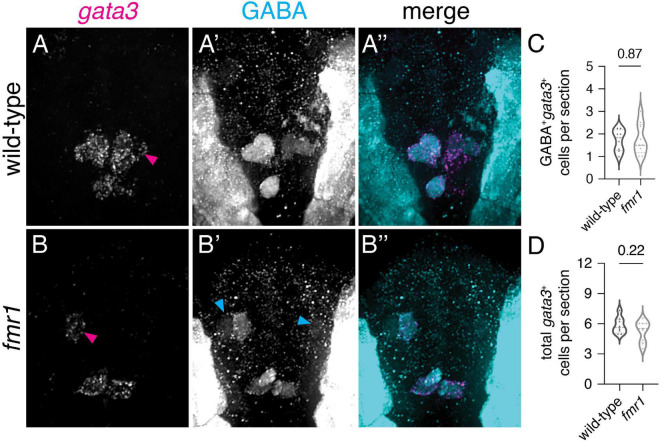
FIGURE 4.
Excess GABAergic neurons in fmr1 embryos are not specified in the p2 progenitor domain. Representative images showing fluorescent RNA in situ hybridization to detect gata3 transcript in wild-type (A) and fmr1 mutant embryos (B) alongside immunohistochemistry for gamma-aminobutyric acid (GABA) (A’,B’) and merged images (A”,B”) at 24 hpf. Quantification of GABA+gata3+ V2b cells [(C); two-tailed t-test] and total gata3+ cells at 24 hpf [(D); two-tailed t-test]. GABA+gata3+ V2b neurons marked with magenta arrows (A,B), GABA+gata3– cells indicated with cyan arrows (B’). Quantification reflects the average number of cells per section, averaged by embryo. Scale bar = 10 μm. P-values indicated in graphs, where p < 0.05 is considered significant. See also Supplementary Figure 3.

