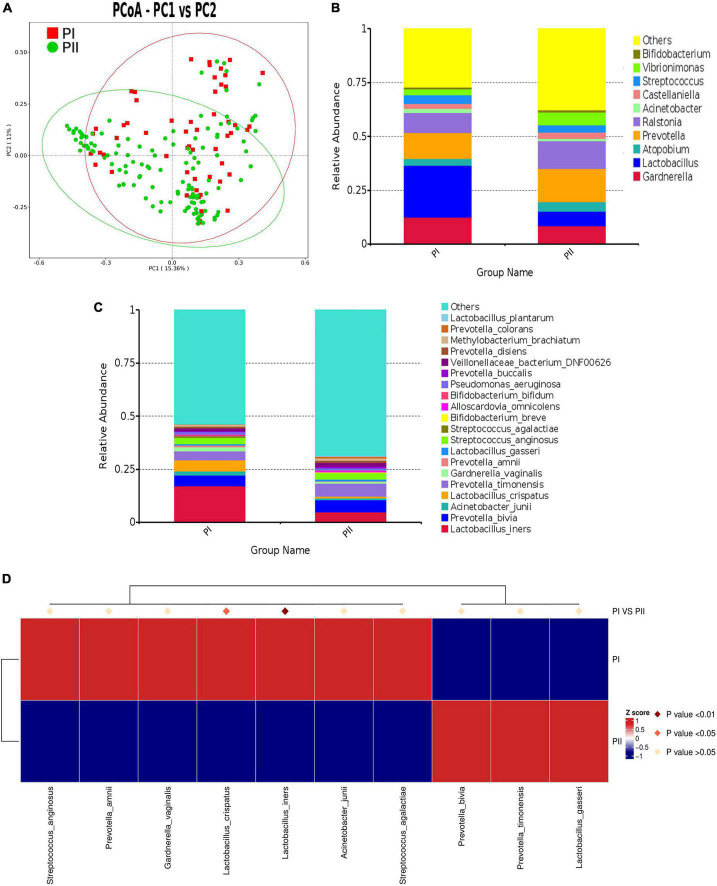
FIGURE 4.
Comparison of microbiota composition between PI and PII Group. (A) PCoA dissimilarity between PI and PII. (B) Histogram of the relative abundance of vaginal microbiota with top 10 genus in PI and PII groups. (C) Histogram of the relative abundance of vaginal microbiota with top 20 species in PI and PII groups. (D) Heat map of the vaginal microbiota in PI and PII groups at species level. PI, postpartum women with relatively good pelvic floor function; PII, postpartum women with relatively poor pelvic floor function.

