Figure 2.
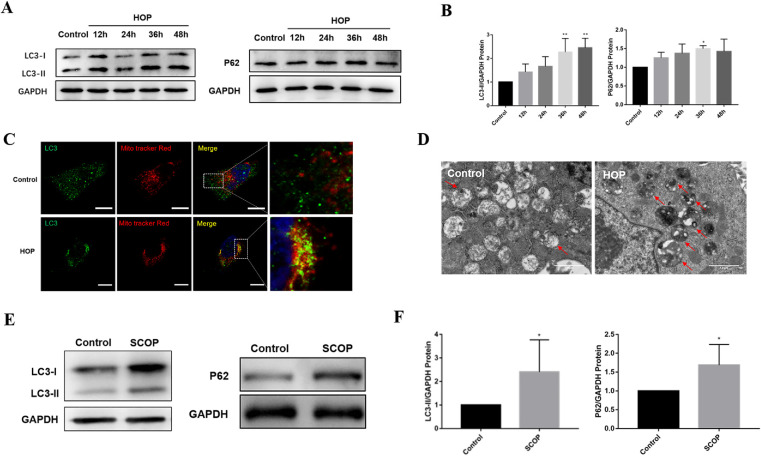
Excessive autophagy and mitophagy in dry eye both in vitro and in vivo. (A) Protein expression level of LC3 and P62 in HCECs was detected by western blot after exposure to HOP for the indicated times. (B) Quantitative analysis of LC3 and P62 protein expression in HCECs (n = 3). (C) Immunofluorescence images showing the co-localization of LC3 and MitoTracker Deep Red–labeled mitochondria. Scale bar: 20 µm. (D) TEM results of untreated and HOP-stressed HCECs. Red arrows indicate undegraded autophagolysosomes. Scale bar: 1 µm. (E) Western blot results of LC3 and P62 expression by conjunctival tissue in normal and dry eye mice. (F) Quantification of LC3 and P62 protein expression in dry eye mice (n = 5). Results are presented as mean ± SD. *P < 0.05, **P < 0.01.

