Fig. 2.
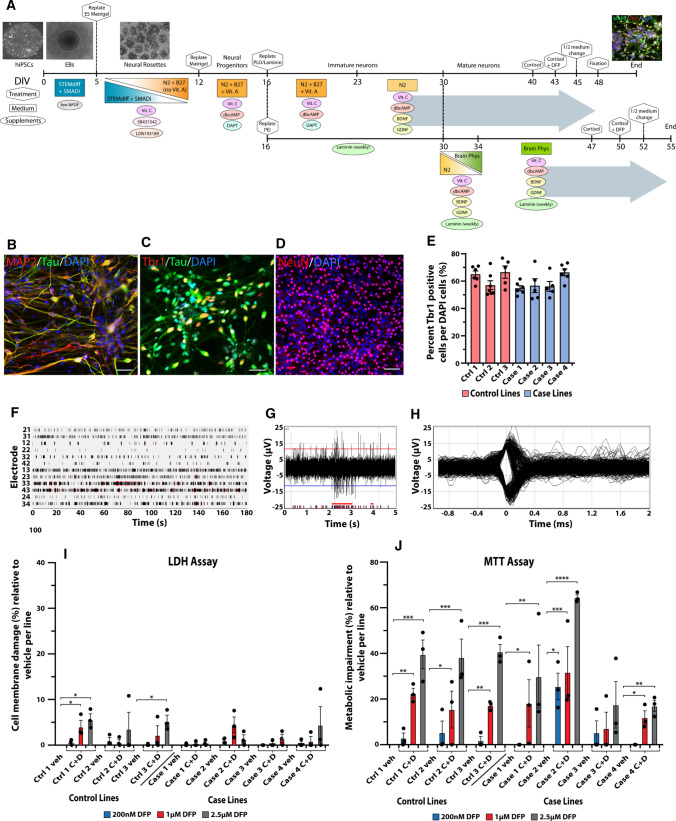
Validation of forebrain glutamatergic neuronal differentiation from veteran-derived hiPSCs and GW toxicant regimen. a Schematic of the neuronal differentiation protocol with phase contrast and immunocytochemical images relevant to each stage. The large gray arrows represent the culture conditions for all experiments (top arrow) except for electrophysiology (bottom arrow). Scale bar for phase contrast images (100 µm) and for immunofluorescent image (20 µm). b–d Immunocytochemical staining for the neuronal markers MAP2, Tau, NeuN, and the forebrain glutamatergic marker Tbr1. Scale bar, 50 µm. e Bar graph shows quantification of the percent of Tbr1-positive cells per total DAPI-stained cells across the seven lines of hiPSC-derived glutamatergic neurons, analyzed using one-way ANOVA with Tukey’s post hoc test. f–h Representative images of spontaneous neuronal firing recorded from a Multiwell MultiElectrode Array. f Raster plot shows the total activity recorded for all 12 electrodes in a sample well. Black lines indicate detected spikes and red bars indicate detected bursts. g Representative spike and burst activity recorded on electrode 43 from F. h Spike waveforms recorded on electrode 43 from F. i, j All 7 hiPSC lines were differentiated into forebrain glutamatergic neurons and exposed to the GW toxicant regimen of 2 µM cortisol plus DFP at three different concentrations (200 nM, 1 µM, and 2.5 µM). The neurons were evaluated for percent cell membrane damage via the LDH assay (i) and the percent metabolic impairment (reduced cell viability) via the MTT assay (j). Each line of hiPSC-derived neurons was exposed to vehicle (veh) or cortisol plus DFP (C + D). Empty bars for vehicle represent no cell damage. All data are represented as mean ± SEM normalized to vehicle per line, and analyzed using one-way ANOVA with Dunnett’s post hoc test. *p < 0.05, **p < 0.01, ***p < 0.001, ****p < 0.0001

