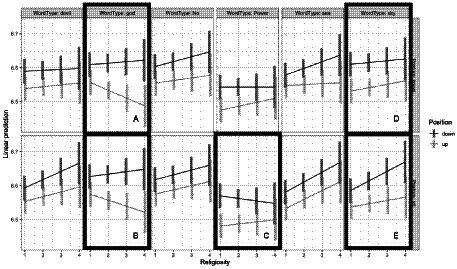
Figure 4.

Log response latency as a function of word type, position, posture, and religiosity. Bars represent confidence intervals on the estimated marginal means.

Log response latency as a function of word type, position, posture, and religiosity. Bars represent confidence intervals on the estimated marginal means.