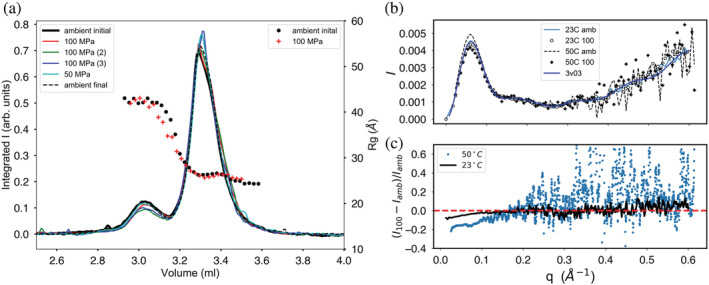
FIGURE 3.

Elution profiles for bovine serum albumin through a series of sample injections at various pressures (listed in the left‐hand legend box). (a) Monomer (main peak) is resolved under pressure from dimer with little change in the overall elution profile shape. The initial (solid black line) and final (dashed line) ambient pressure profiles overlay closely, demonstrating column bed stability through the pressure cycle. Radius of gyration Rg calculated along the profiles (symbols) shows plateaus at both peaks with a subtle drop in value under pressure. (b) Kratky plots show that changes in X‐ray scattering with pressure are confined to the small‐angle portion of the scattering profiles. (c) The change in scattering with pressure is most clearly seen by plotting relative deviation at fixed temperature
