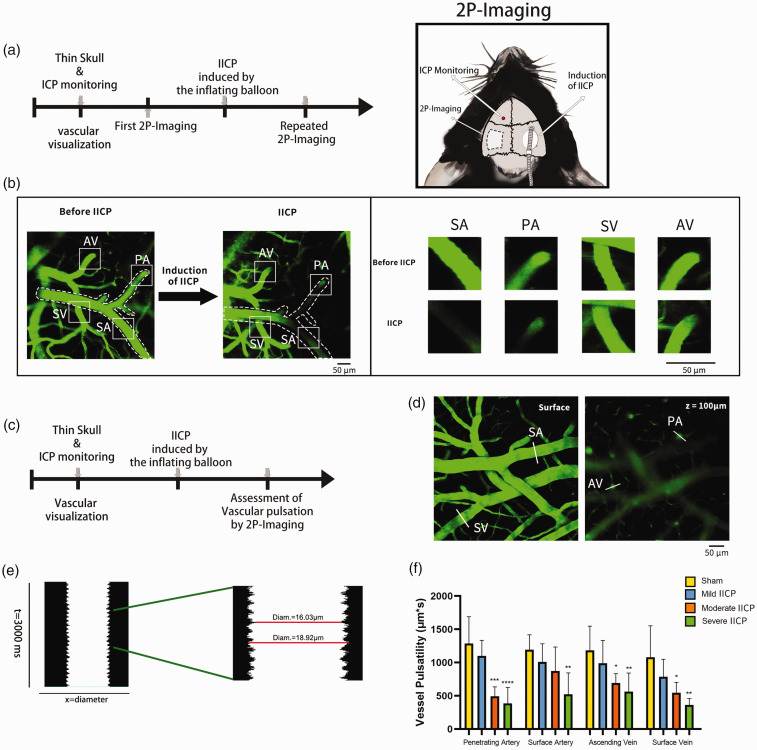
Figure 4.
Analysis of vascular pulsation during IICP. (a) Experimental timeline for in vivo observation of vascular changes before and after IICP, and schematic diagram for two-photon in vivo imaging. (b) The cerebrovascular column is visualized by injecting 2000 kD RITC-dextran intravenously (left image: collapsed 100 mm XYZ stack, magnification: X20). Cerebrovascular measurements at the same site were repeated before and after IICP (Representative picture: moderate IICP). Reduced or even occluded blood flow and significantly reduced arterial pulsation in superficial arteries and superficial veins can be observed in this image. Superficial vein (SV), superficial artery (SA), penetrating artery (PA), and ascending vein (AV) were classified according to morphology (shown by a solid white box). A white dotted line shows an almost occluded artery vessel. (c) Experimental timeline for quantitating vascular pulsation in the IICP and SHAM groups in vivo. (d) Three-second XT line scans orthogonal to the vessel axis, capturing the dynamic change in vessel diameter across time, are acquired at the brain's surface or a depth of 100 mm below the surface (shown by a solid white line). (e) vessel diameter was extracted from X–T plots by Matlab and plotted versus time. Steady-state vessel diameters were calculated as the mean value over the 3000 ms epoch. Vessel wall pulsatility (derived units µm × s) was calculated as the absolute value of area under the diameter integrated about the running average over the 3000 ms epoch and (f) Quantification of vascular pulsation shows a significant decrease in the IICP groups when compared to sham groups for all four types of vessels (vs. sham; *p < 0.05, **p < 0.01, ***p < 0.001, ****p < 0.0001). In (f), the data is presented as mean ± SD (n = 6 animals per group, with one-way ANOVA followed by Tukey's post-hoc test).

