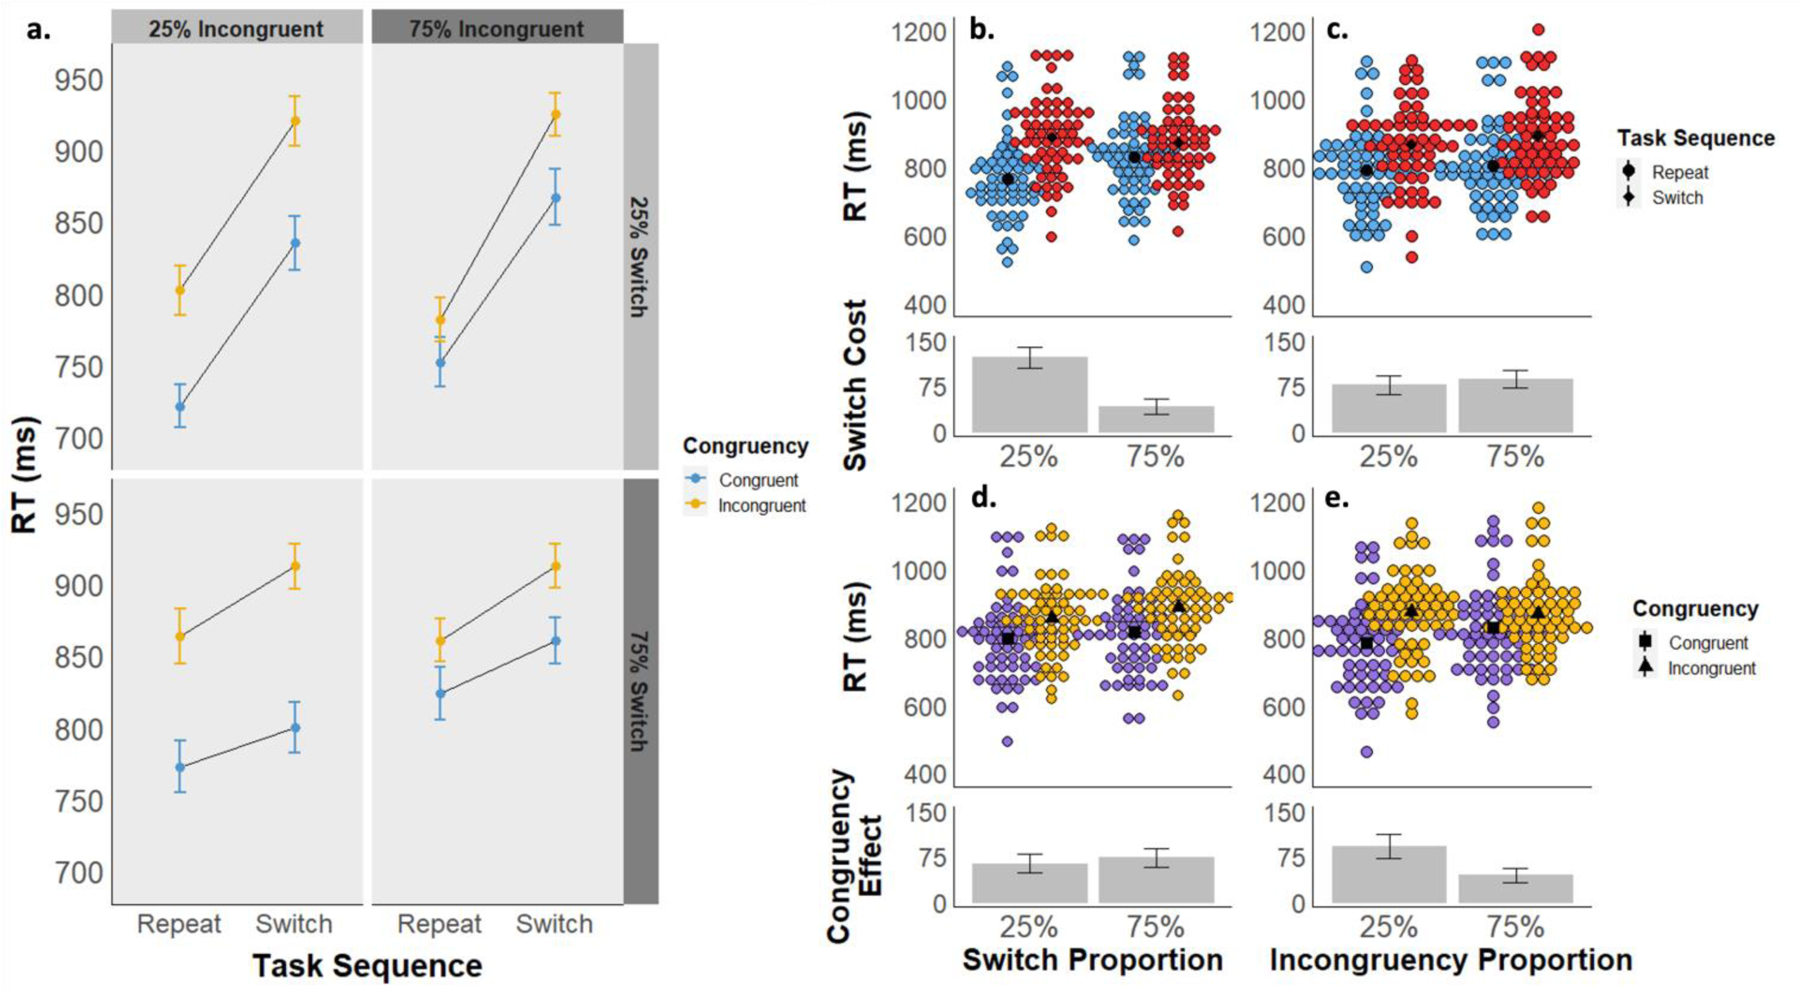
Figure 2:

a) Experiment 1 mean reaction times are displayed as a function of task sequence (switch vs. repeat), stimulus congruency (congruent vs. incongruent), switch proportion (25% vs. 75%), and incongruency proportion (25% vs. 75%). b-e) Experiment 1 mean RTs are displayed as a function of task sequence (panels b and c) and congruency (d and e), collapsed across block-wise switch proportions (b and d) and block-wise congruency proportions (c and e). The upper graphs in each panel depict mean RTs by subject for each condition, and the lower graphs depict the mean RT difference between conditions.
