
Figure 2.
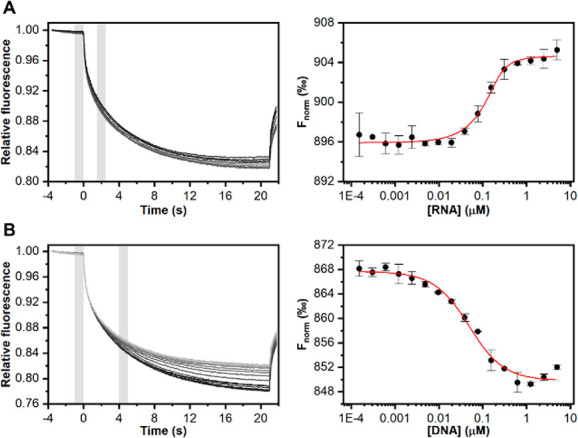
MST measurements for the hybridization of the labeled oligonucleotide with (A) RNA and (B) DNA complementary target sequences in solution. (left) Fluorescence time traces recorded by incubating increasing concentrations of the target sequences with the labeled oligonucleotide. (right) Corresponding binding curves. Error bars represent standard error of the mean.