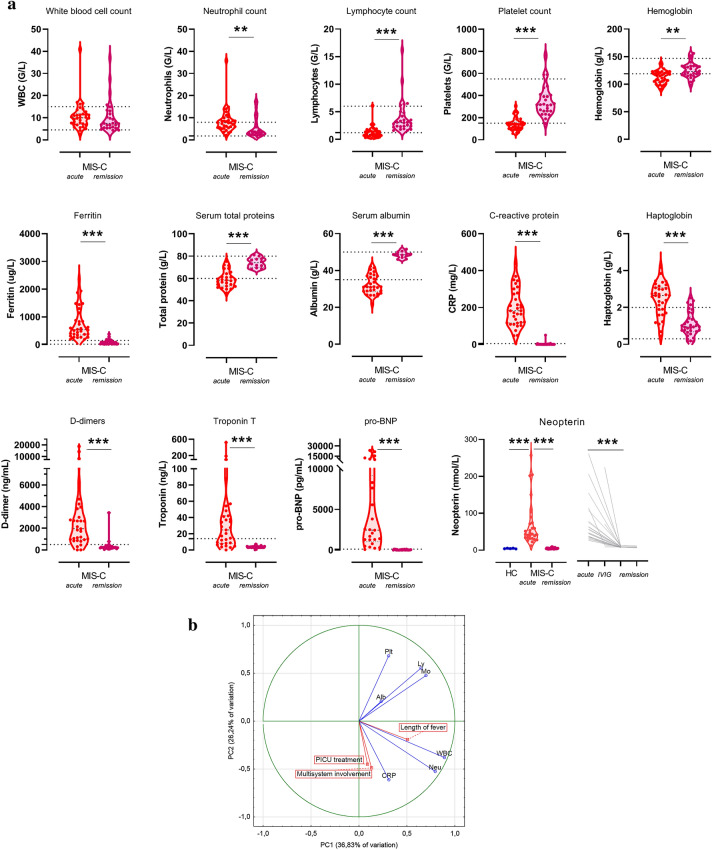
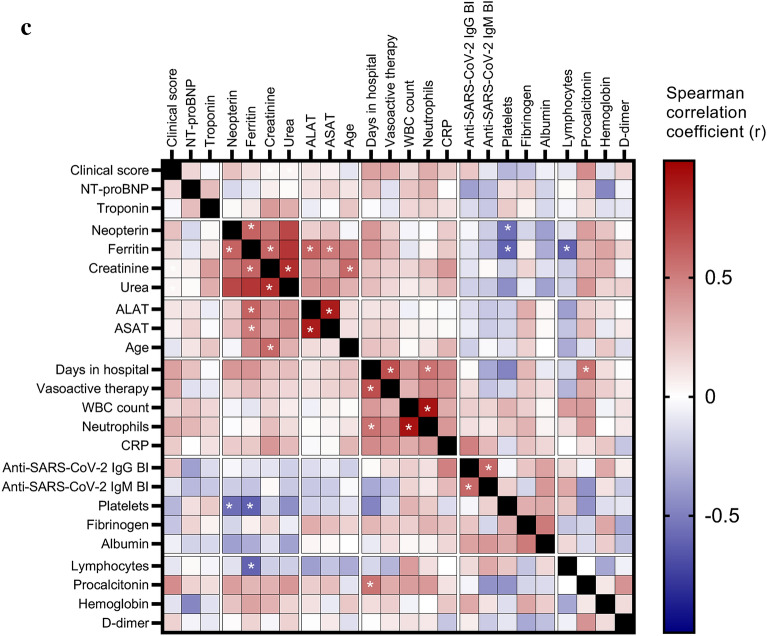
Figure 2.
Disease severity marker levels before and after IVIG therapy in the MIS-C cohort. (a): Pre- and > 10 days post-IVIG treatment (denoted acute and remission) absolute blood counts and clinical laboratory results of the 34 MIS-C cases. The horizontal lines indicate the age-specific reference ranges. Since no established reference range was available for neopterin, results of healthy controls are shown for this marker, together with individual changes of levels during IVIG treatment and in remission. P value symbols (**p < 0.01, ***p < 0.001) indicate significant results after 5% false discovery rate correction using the Benjamini–Hochberg method. (b): Principal component analysis loading plot of the top 7 features contributing to principal components one and two. Loading of length of fever, PICU treatment and extent of multisystem involvement (indicated by boxes) are shown as supplementary variables. (c): Heatmap of correlation matrix of clinical and laboratory markers of MIS-C. Clinical score indicates the total number of organ systems involved, including skin (rash, feet and hands signs), mucosal (conjunctivitis, cheilits, oral mucositis), gastrointestinal (diarrhea, vomiting, abdominal pain) and cardiac involvement. Color-coding indicates the strength of each correlation (Spearman correlation coefficients) with asterisks indicating significance (* indicate p < 0.003 significant results, the limit was obtained after 5% false discovery rate correction using the Benjamini–Hochberg method). Non-significant differences are not marked.


