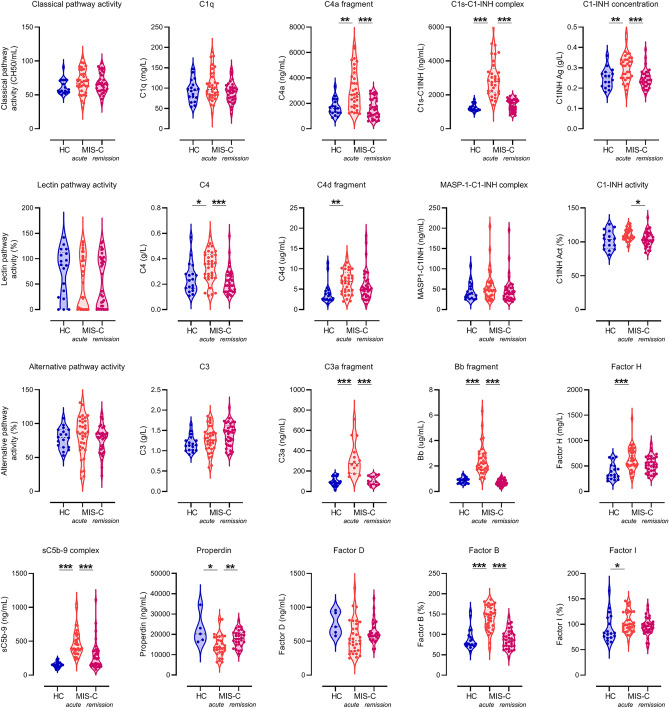
Figure 3.
Detailed complement profile of the MIS-C cohort before, during and after IVIG therapy, and of healthy controls. Levels of the complement pathway (classical-, lectin- and alternative) activities, factors (C1q, C4, C3, Factors D, B and properdin) and regulators (C1-inhibitor antigen and activity, Factors H and I) were determined in serum, whereas that of activation products (C1s-C1-inhibitor complex, MASP1-C1-inhibitor complex, C4a, C4d, C3a, Bb and sC5b-9) in EDTA plasma. Violin plots (with dashed horizontal lines indicating the median values, dotted lines indicating the quartiles) show results for the 18 healthy control children (HC), and for all MIS-C cases who had samples from acute stage, before IVIG treatment, or from stable remission after hospital discharge. P values for the pair-wise group comparisons (HC-acute and acute-remission groups) on the violin plots were calculated by the Mann–Whitney test. Non-significant differences are not marked, and p value symbols (*p < 0.05, **p < 0.01, ***p < 0.001) indicate significant results after 5% false discovery rate correction using the Benjamini–Hochberg method.

