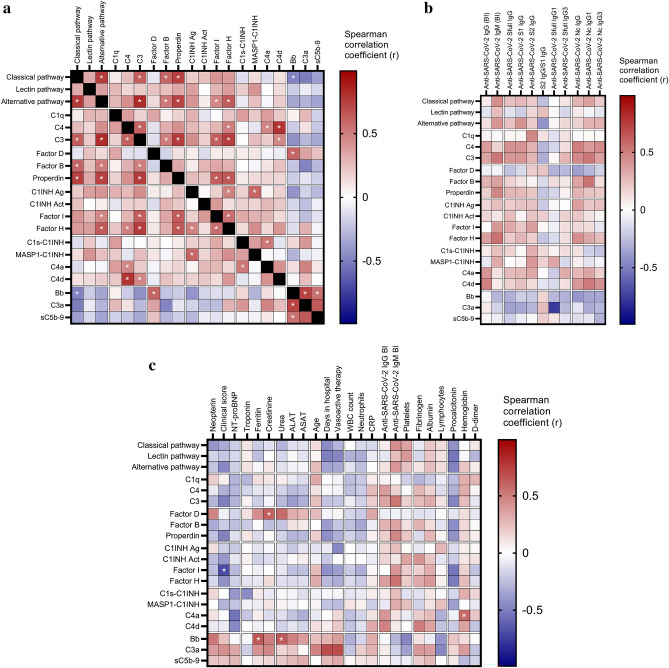
Figure 4.
Associations between complement markers, clinical, laboratory and anti-SARS-CoV-2 humoral immune response features in the MIS-C cohort. Heatmap of correlation matrix of complement markers (Panel (a), complement markers and clinical and laboratory features (Panel b), complement markers and SARS-CoV-2 humoral immune response measures (Panel c). Color-coding indicates the strength of each correlation (Spearman correlation coefficients) with asterisks indicating significance (* indicate on Panel (a) p < 0.007, on Panel (c) p < 0.005 significant results, the limit was obtained after 5% false discovery rate correction using the Benjamini–Hochberg method).

