
Figure 6.
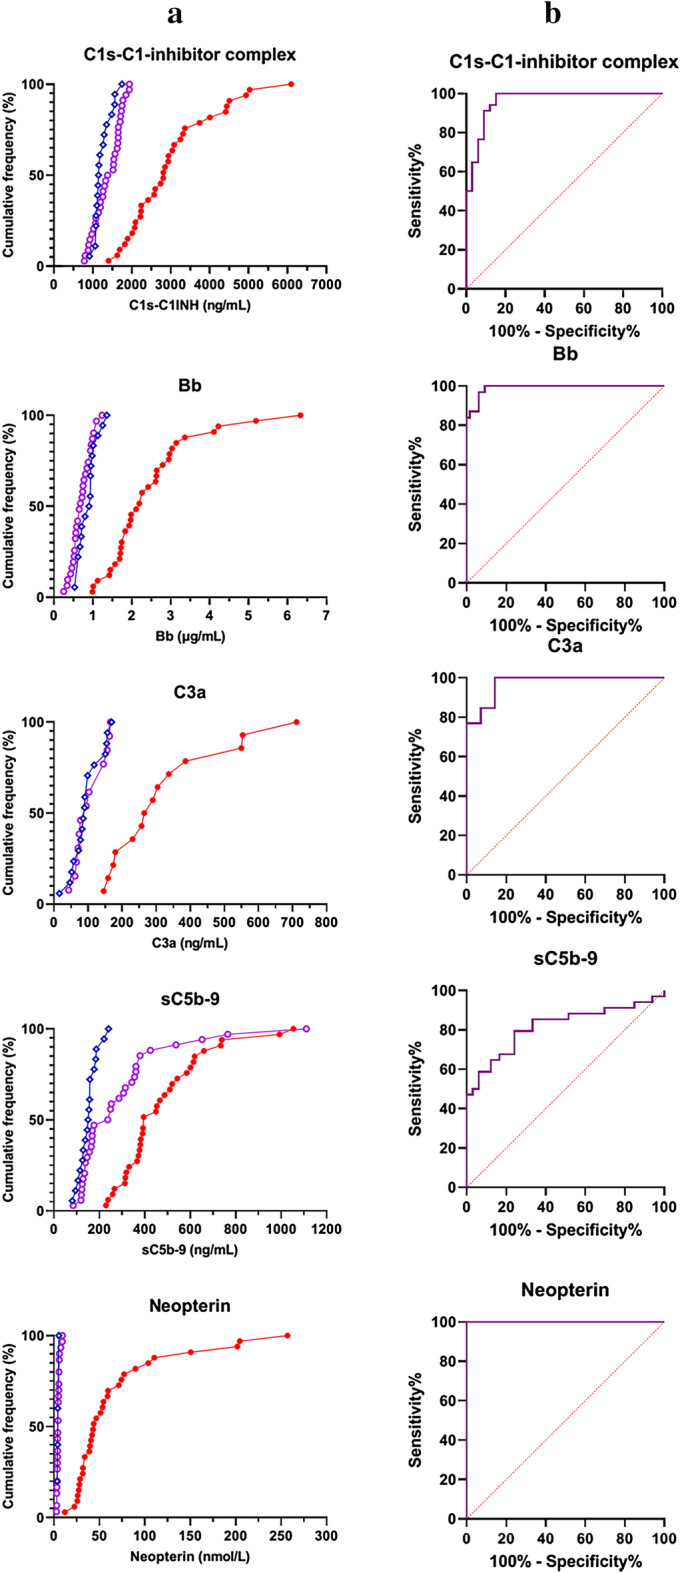
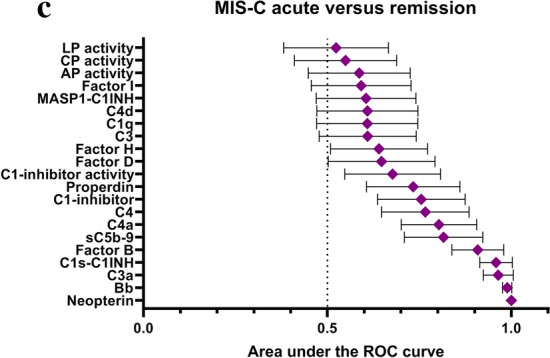
Ranking of complement and macrophage measures as markers of acute MIS-C and therapy response (a): Cumulative frequencies (%) of MIS-C cases in acute (red, solid circles) or in remission (purple, open circles) stage, and of healthy controls (blue, open rhombus), plotted against the range of selected complement- and macrophage activation markers. (b): Performance of complement activation marker and neopterin levels to describe therapy responses in MIS-C (ROC-analysis). (c): Area under the curve (AUC) values with 95% confidence intervals.