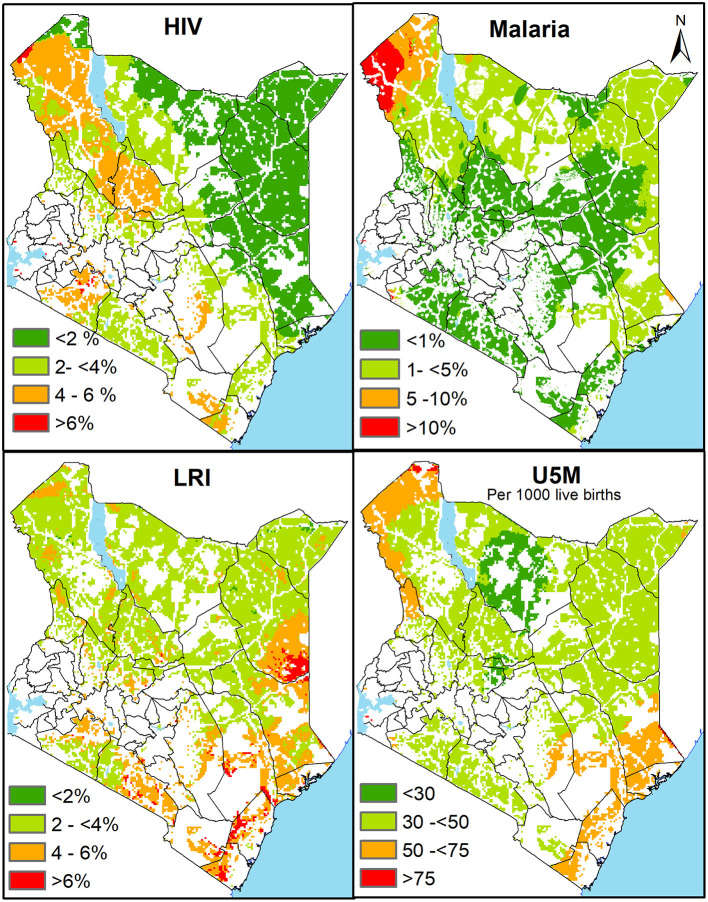
Figure 4.
The spatial variation of infection prevalence of HIV, Malaria, LRI and under five mortality in areas outside 1-h catchment of the nearest health facility (public and private) in 2021. Red represents areas of dual burden with high disease prevalence or mortality and over 1-h distance from health facility while green shades represent regions of lower disease prevalence or mortality outside 1-h.

