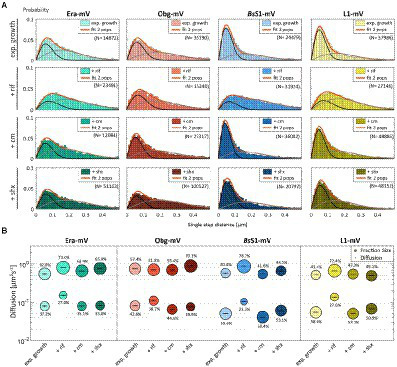
Figure 4.

Single-molecule tracking of C-terminal mVenus fusions of the GTPases Era and Obg and the ribosomal proteins L1 and BsS1 during exponential growth. For single-molecule experiments during physiological perturbations, cells were treated with rifampicin or chloramphenicol for 30 min, or with or DL-serine hydroxamate for 10 min prior to tracking. (A) Using jump distance analyses the resulting data were analysed and the probabilities of single step distances plotted up to a maximum value of 0.5 μm. The two-population fit (orange curve) together with its static (dark grey) and mobile (light grey) population suited the data well. (B) Bubble plots represents the D of the population on the y-axis by height and population size by the bubble diameter. Corresponding values can be found in Table 1.
