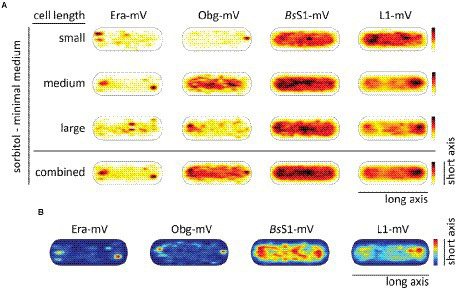
Figure 6.

Heat maps showing nucleoid occlusion of GTPases and ribosomes under slow growth conditions. (A) Heat maps of the trajectories separated by a qualitative cell size give an example of how the molecule localization changes when larger cells possess two chromosomes. (B) Tracks that show confined motion within a certain dwell radius are most likely being bound to a larger complex and thus giving a hint to the point of action of the protein. The used dwell radii (which was set as three times the localization error) can be found in Supplementary Table S2. A variation in the maximum value of the scale results in a different coloration of the maps. For a better understanding in the case of a lighter overall coloration the maximum values are also given in Supplementary Table S2.
