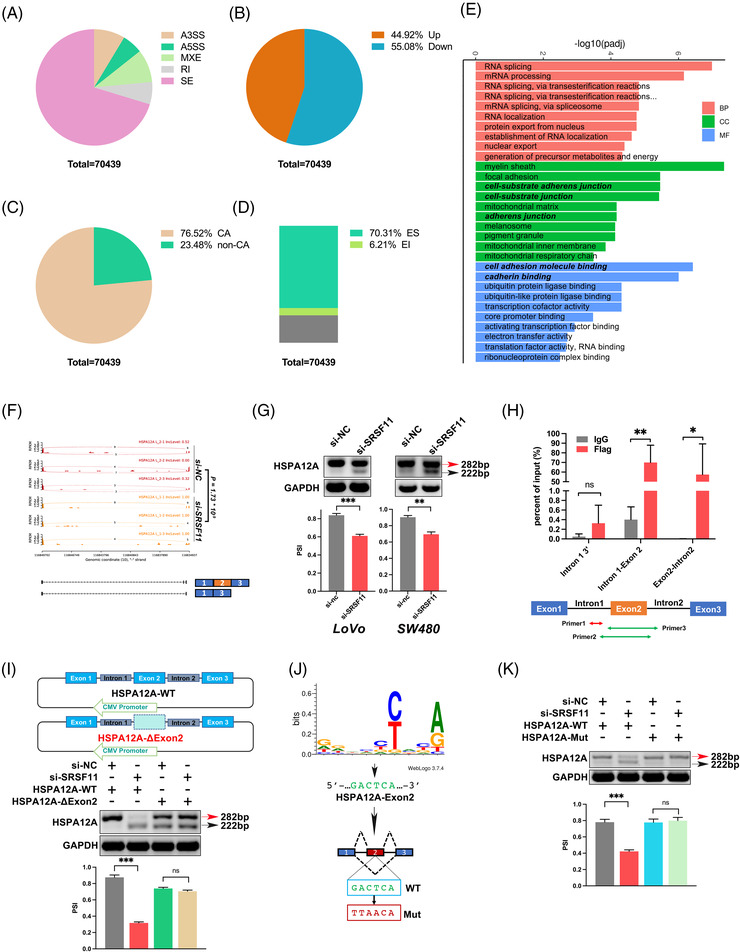
FIGURE 3.

AS and transcriptome profiles regulated by SRSF11 in LoVo cells. (A–D) The proportion regulated by SRSF11 classified by AS types (A), PSI value (B), cassette exons AS (C and D). (E) Gene ontology of the differentially expressed genes between si‐NC and si‐SRSF11 LoVo cells. |LogFC| > 1, FDR < 0.05. (F) SRSF11 regulated HSPA12A pre‐RNA splicing and promoted the inclusion of HSPA12A exon 2. (G) SRSF11 triggered SE events of the HSPA12A pre‐RNA. RT‐PCR results and quantification of their RNA products were measured as inclusion/(inclusion+exclusion) (PSI) below. Note that alternative exon 2 for SRSF11‐mediated inclusion is marked in red while SRSF11‐mediated exclusion is marked in black arrow (N = 3, Student t′ test; *p < .05, **p < .01). (H) CLIP‐qPCR analysis of SRSF11 association with HSPA12A pre‐RNA at the indicated locations. IgG, control immunoglobulin (N = 3, Student t′ test; ns, no significance, *p < .05, **p < .01). (I) The top shows the schematic diagram of the HSPA12A mini‐gene constructs (HSPA12A‐WT and HSPA12A‐ΔExon 2). The bottom exhibits the in vivo splicing analysis of HSPA12A mini‐gene and indicated deletion mutants in LoVo cells. Quantification analysis is shown below (N = 3, SNK test; ns, no significance, ***p < .001). (J) Deduced SRSF11 binding consensus based on the SE events from our RNA‐seq results. The green font represents the matched sequences within exon 2 of HSPA12A, and the red font indicates the random mutation. (K) in vivo splicing analysis of HSPA12A mini‐gene and indicated deletion mutants in LoVo cells. Quantification analysis is shown below (N = 3, SNK test; ns, no significance, ***p < .001).
