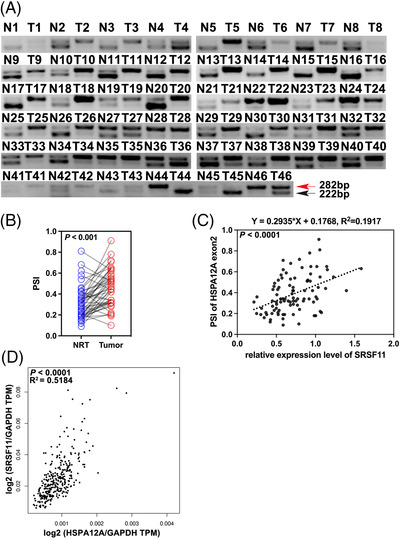
FIGURE 5.

Increased inclusion of HSPA12A exon 2 parallels increased SRSF11 expression in clinical CRC samples. (A) RT‐PCR analysis of different HSPA12A transcripts in Cohort 1 samples. (B) The statistical diagram of A (N = 46; Student t′ test). (C) Correlation between PSI ratio and SRSF11 expression levels in Cohort 1 samples (Pearson correlation test). (D) Correlation between SRSF11 and HSPA12A expression levels in COAD and READ tissues from TCGA database (Pearson correlation test)
