
Figure EV2. TgCRMPa‐ and TgCRMPb‐depleted tachyzoites have normal rhoptries, and show no defects in replication, stimulated egress, and attachment (related to Fig 2).
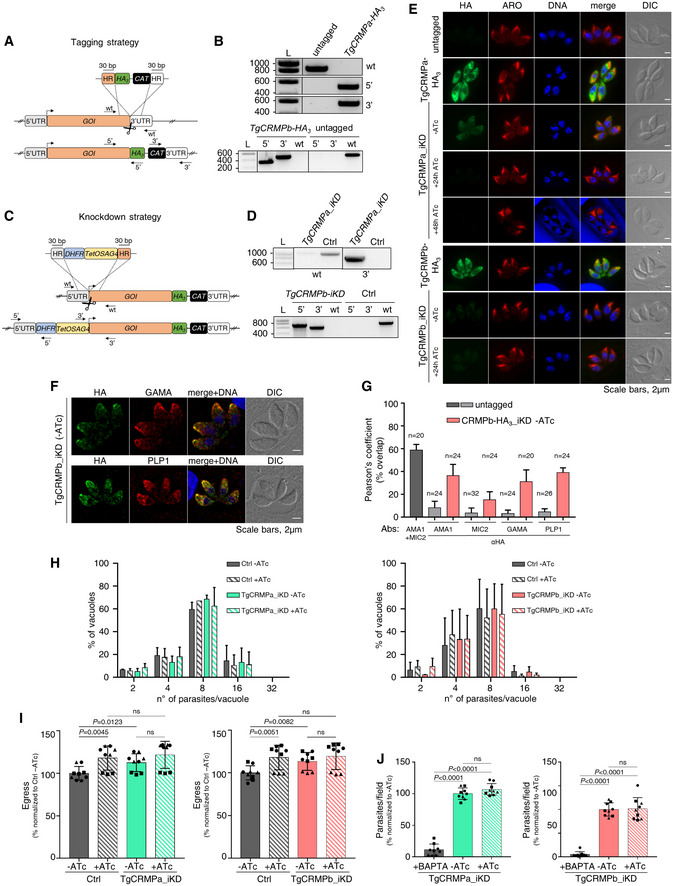
- Strategy for tagging genes of interest (GOI) in Toxoplasma. To generate C‐terminal HA3‐fusions of TgCRMPa and TgCRMPb, a DNA fragment was amplified from a donor vector containing the HA3 tag and the drug resistance cassette (CAT). Primers to amplify the DNA fragment were designed to contain ~ 30‐bp‐long stretches (HR) homologous to the GOI regions flanking the insertion site for the epitope tag. Upon CRISPR‐cas9 cut (scissors), the PCR‐amplified DNA fragment efficiently recombines into the targeted endogenous locus. The arrows indicate the binding sites of the primers used in (B).
- Integration of the HA3 tag and CAT cassette at the C‐terminus of TgCRMPa (upper panel) and TgCRMPb (lower panel) was tested by PCR. Genomic DNA from the untagged line and a clonal population for each of the putative HA3‐tagged lines was amplified with primers binding to the 3′ C‐terminus and 3′UTR of each TgCRMP gene, in pairwise combination with primers binding the HA3 and CAT sequences, respectively. The fragments corresponding to the HA3 tag (5′) and the resistance cassette (3′) were correctly amplified in the putative tagged lines, indicating that they were efficiently integrated at the TgCRMPs loci. As expected, the wild‐type fragment of each gene (wt) was detected only in the untagged line. L: DNA ladder (bp). Primers are listed in Table EV1.
- Strategies for the inducible depletion (iKD) of genes of interest (GOI) in Toxoplasma. The iKD lines for TgCRMPs were generated starting from the HA3‐tagged lines previously produced. In order to conditionally deplete the proteins, the endogenous promoter of each gene was replaced with an ATc‐regulatable TetOSag4 promoter, preceded by the DHFR resistance cassette. The DNA fragment containing the cassette and the promoter was PCR amplified from a donor vector with primers containing ~ 30‐bp‐long homology regions (HR) specific for each gene and introduced upstream the starting codon via CRISPR‐cas9 technology (scissors) and homologous recombination. The arrows indicate the binding sites of the primers used in (D) and Fig EV3G.
- Integration of the TetOSag4 promoter in TgCRMPa‐HA3 (upper panel) and TgCRMPb‐HA3 (lower panel) lines were tested by PCR. Integration of the DHFR resistance cassette was successfully PCR‐amplified only for TgCRMPb‐HA3 (lower panel) line. Genomic DNA from untagged parasites and putative TgCRMPa_iKD and TgCRMPb_iKD clonal populations was amplified with primers binding to the 5′UTR and 5′ N‐terminus of the GOI, flanking the DHFR‐TetOSag4 insert, and used also in pairwise combination with primers binding the DHFR cassette and the TetOSag4 promoter, respectively. The fragments corresponding to the DHFR integration (5′) and TetOSag4 integration (3′) were detected exclusively in the putative iKD lines, while the wild‐type fragment (wt) was amplified only in the untagged line. L: DNA ladder (bp). Primers are listed in Table EV1.
- Immunofluorescence images of untagged, TgCRMPa‐HA3, and TgCRMPb‐HA3 lines and TgCRMPs‐depleted (iKD) intracellular tachyzoites. Parasites were stained with anti‐HA and anti‐ARM (ARO) Abs to visualize TgCRMPs and rhoptries, respectively. The nuclei (DNA) are stained with Hoechst. TgCRMPs pattern mirrors that of Fig 2B. Rhoptries show a wild‐type appearance in the TgCRMPs‐depleted parasites. Shown are single focal planes.
- Confocal immunofluorescence images of TgCRMPb‐depleted (iKD) intracellular tachyzoites. Parasites were stained with anti‐HA and with anti‐GAMA and anti‐PLP1 Abs to visualize TgCRMPb and micronemes, respectively. The nuclei (DNA) are stained with Hoechst. Shown are single focal planes.
- Extent of co‐localization between TgCRMPb‐HA3 (light red) and microneme proteins AMA1, MIC2, GAMA, and PLP1 shown in (F) and Fig 2D. Untagged parasites were analyzed in parallel to estimate the background noise (light gray), and the extent of overlap between the microneme proteins AMA1 and MIC2 (dark gray). Pearson's correlation coefficient was measured using the Fiji‐JACoP plugin. Values are expressed as mean ± SD; n, number of parasites analyzed.
- Replication measured for TgCRMPa‐ and TgCRMPb‐depleted parasites. The percentage of vacuoles with 2, 4, 8, 16, and 32 parasites was calculated for control (Ctrl), and TgCRMPa_iKD and TgCRMPb_iKD lines, in the absence of ATc and upon 48 and 24 h ATc treatment, respectively. Both iKD mutants (+ATc) are capable of efficient replication. Data are reported as mean ± SD (n = 2 biological replicates, each with three technical replicates).
- Stimulated egress was quantified for TgCRMPa‐ and TgCRMPb‐depleted parasites. Infected cells with intact vacuoles were treated with A23187 to induce parasite egress, measured as a number of burst vacuoles over the total number of vacuoles. Egress was tested for control (Ctrl), TgCRMPa_iKD and TgCRMPb_iKD lines, in the absence of ATc and upon 48 and 24 h ATc treatment, respectively. Values are reported as mean ± SD (n = 3 biological replicates, each with three technical replicates). The biological replicates are represented by different symbols. P‐values are non‐significant for all datasets (two‐tailed t‐test).
- Attachment measured for TgCRMPa‐ and TgCRMPb‐depleted parasites. The number of parasites attached to the host cell was counted for control (Ctrl), TgCRMPa_iKD and TgCRMPb_iKD lines, in the absence of ATc and upon 48 and 24 h ATc treatment, respectively. BAPTA treatment was used as a control since it prevents attachment. TgCRMPa‐ and TgCRMPb‐depleted parasites were able to attach to host cells. Values are reported as in (I; n = 3 biological replicates, each with three technical replicates). The biological replicates are represented by different symbols. P‐values were measured by a two‐tailed t‐test.
Source data are available online for this figure.