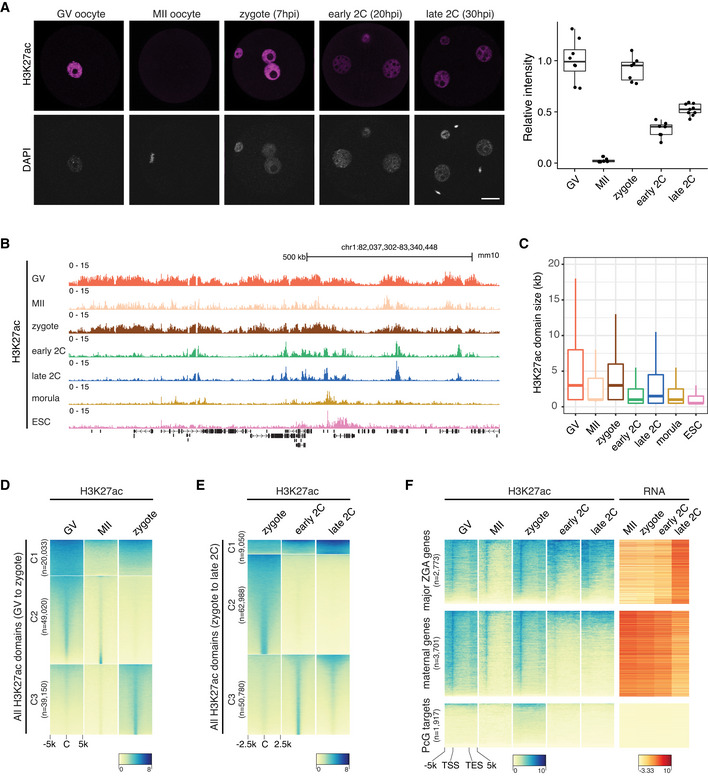
Figure 1. Dynamic landscape of H3K27ac in mouse oocytes and early embryos.

- Immunostaining of H3K27ac in mouse germinal vesicle (GV) oocytes (n = 8), metaphase II (MII) oocytes (n = 7), zygotes (n = 7), early 2‐cell (2C; n = 7) and late 2C (n = 9) embryos. Right panel is the quantification of H3K27ac immunostaining relative signal intensities at different stages. Scale bar: 20 μm.
- Genome browser view showing the landscape of H3K27ac in oocytes and early embryos.
- H3K27ac domain size distribution at different stages.
- Dynamic changes of H3K27ac from GV oocytes to zygotes. All the H3K27ac domains from GV to zygote were classified into three clusters (C1–C3) using k‐means clustering. C—domain center.
- Dynamic changes of H3K27ac from zygotes (before ZGA) to late 2‐cell embryos (major ZGA). All the H3K27ac domains from zygotes to late 2‐cell embryos were classified into three clusters (C1–C3) using k‐means clustering.
- Enrichment of H3K27ac at major ZGA genes, maternal decay genes and Polycomb group (PcG) targets at different stages. TSS—transcription start site; TES—transcription end site.
Data information: For boxplots in (A) and (C), the central band represents the median. The lower and upper edges of the box represent the first and third quartiles, respectively. The whiskers of the boxplot extend to 1.5 times interquartile range (IQR).
